
 Kommander Documentation
KUDO Spark
Kommander Catalog adds integration for KUDO Spark Operator, which simplifies day 2 operations of Apache Spark.
KUDO Introduction
Kubernetes Universal Declarative Operator (KUDO) provides a declarative approach to building production-grade Kubernetes operators.
- KUDO is built to help manage day 2 operations of services on Kubernetes, including stateful services, through the management of operators.
- KUDO is built to support upgrades of services along with backup, recovery, and the needs of observability.
- KUDO is integrated into Kommander and does not require any initialization via the KUDO CLI
The following articles give an overview of KUDO:
It is strongly recommended to view the KUDO Spark Documentation which covers the KUDO Spark Operator in-depth. This document covers the integration aspects of KUDO Spark Operator with Kommander.
Installation
Kommander Catalog
KUDO Spark is located in the Kommander Catalog. To access the catalog:
- Create a Workspace
- Attach a Cluster to the Workspace
- Create a Project in the Workspace
- Select the created Project
- View the available Platform Services in the Project Catalog
- Select the version you’d like to deploy from the version drop-down, and then select Deploy.
Below is an example of what should appear in the Kommander UI. The dialog is populated with defaults:
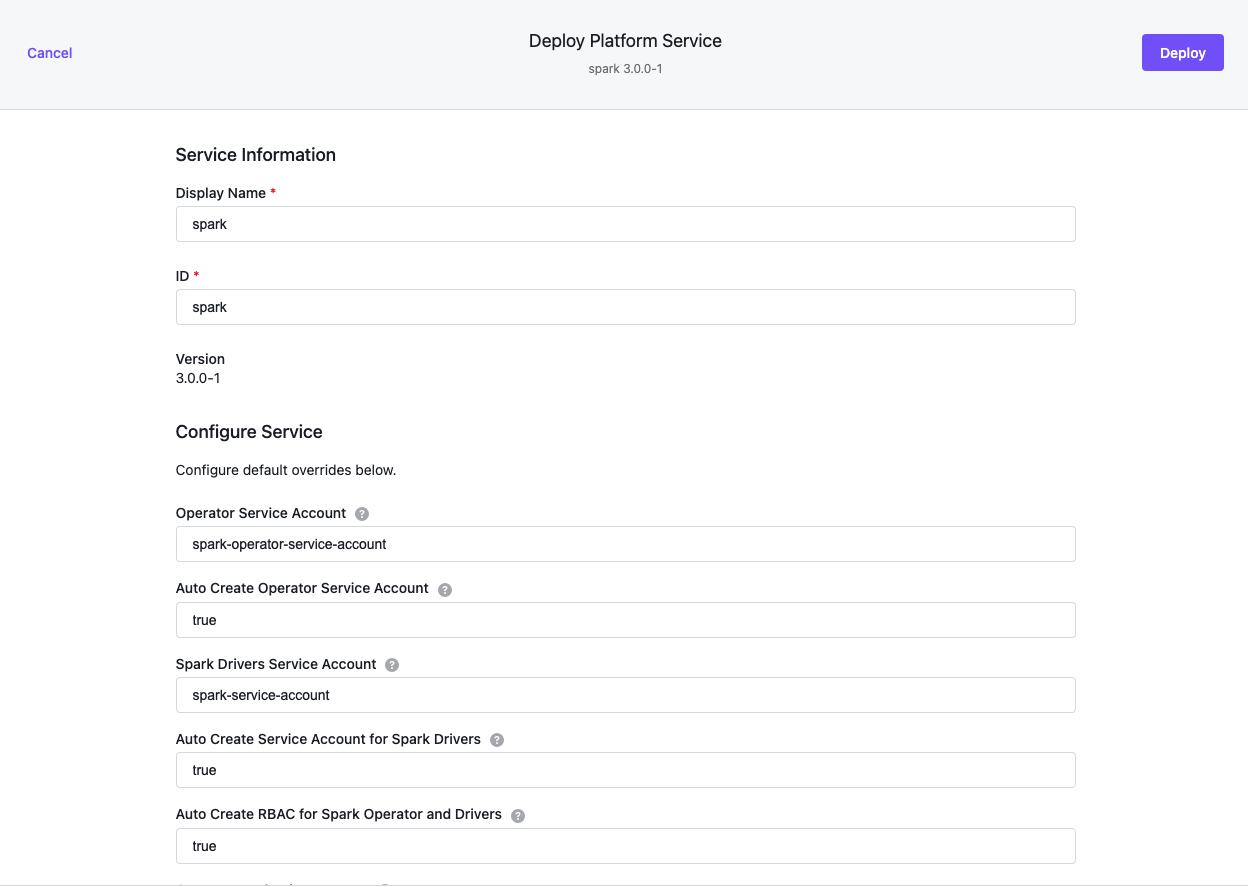
- The ID field above is referred to as the Spark
instanceby KUDO. - Detailed parameter descriptions and defaults are available for each version of KUDO Spark Operator, in this case version
3.0.0-1.1.0
Select Deploy to install Spark.
- Kommander will proceed to install
kudo-controller-managerin thekudo-systemnamespace if it does not already exist. This is the equivalent of issuingkubectl kudo initmanually on the CLI. - KUDO will then install Spark in the Project namespace created using Kommander.
- The deployment progression can be viewed by looking at the
deployplan.
kubectl kudo plan status --instance spark-instance --namespace test-project
Plan(s) for "spark-instance" in namespace "spark":
.
└── spark-instance (Operator-Version: "spark-1.1.0" Active-Plan: "deploy")
    └── Plan deploy (serial strategy) [COMPLETE], last updated 2021-01-25 12:24:26
        ├── Phase preconditions (serial strategy) [COMPLETE]
        │   ├── Step crds [COMPLETE]
        │   ├── Step service-account [COMPLETE]
        │   └── Step rbac [COMPLETE]
        ├── Phase webhook (serial strategy) [COMPLETE]
        │   └── Step webhook [COMPLETE]
        ├── Phase spark (serial strategy) [COMPLETE]
        │   └── Step spark [COMPLETE]
        ├── Phase monitoring (serial strategy) [COMPLETE]
        │   └── Step monitoring [COMPLETE]
        └── Phase history (serial strategy) [COMPLETE]
            ├── Step history-deploy [COMPLETE]
            └── Step history-service [COMPLETE]
Using KUDO CLI
Requirements:
- Install the KUDO controller
- Install the KUDO CLI
Check existing limitations before installing a KUDO Spark instance. Currently, multi-instance (multi-tenant) operator installation supports only a single instance per namespace.
Create a namespace for the operator:
kubectl create ns spark
Install a new instance of Spark operator from the official repository, use the following command:
kubectl kudo install spark --namespace spark
This will install a Spark operator instance with the name spark-instance to the provided namespace.
You can also specify a different instance name using the --instance parameter:
kubectl kudo install spark --instance spark-operator --namespace spark
Verify if the deploy plan for --instance spark-instance is complete:
kubectl kudo plan status --instance spark-instance --namespace spark
Plan(s) for "spark-instance" in namespace "spark":
.
└── spark-instance (Operator-Version: "spark-1.1.0" Active-Plan: "deploy")
    └── Plan deploy (serial strategy) [COMPLETE], last updated 2021-01-25 12:24:26
        ├── Phase preconditions (serial strategy) [COMPLETE]
        │   ├── Step crds [COMPLETE]
        │   ├── Step service-account [COMPLETE]
        │   └── Step rbac [COMPLETE]
        ├── Phase webhook (serial strategy) [COMPLETE]
        │   └── Step webhook [COMPLETE]
        ├── Phase spark (serial strategy) [COMPLETE]
        │   └── Step spark [COMPLETE]
        ├── Phase monitoring (serial strategy) [COMPLETE]
        │   └── Step monitoring [COMPLETE]
        └── Phase history (serial strategy) [COMPLETE]
            ├── Step history-deploy [COMPLETE]
            └── Step history-service [COMPLETE]
You can view all configuration options in the GitHub documentation
Uninstalling the Spark Operator
The KUDO Spark Operator installation includes Custom Resource Definitions (CRDs) for Spark Applications and the KUDO Spark Operator instances. While Operator instance can be used on a per-namespace basis, the Custom Resource Definitions are a cluster-scoped resource which requires a manual cleanup when all KUDO Spark Operator instances are uninstalled.
To completely remove KUDO Spark Operator from a Kubernetes cluster:
-
Wait for the running jobs to complete or terminate them
kubectl delete sparkapplications --all kubectl delete scheduledsparkapplications --all -
Uninstall each KUDO Spark Operator instance:
kubectl kudo uninstall --instance spark-instance --namespace spark -
Remove Spark Applications CRDs:
kubectl delete crds sparkapplications.sparkoperator.k8s.io scheduledsparkapplications.sparkoperator.k8s.io
Installing multiple Spark Operator Instances
Optionally, create dedicated namespaces for installing KUDO Spark instances(for example, spark-operator-1 and spark-operator-2 in this example):
kubectl create ns spark-operator-1 && kubectl create ns spark-operator-2
kubectl kudo install spark --instance=spark-1 --namespace spark-operator-1 -p sparkJobNamespace=spark-operator-1
kubectl kudo install spark --instance=spark-2 --namespace spark-operator-2 -p sparkJobNamespace=spark-operator-2
The above commands will install two Spark Operators in two different namespaces. Spark Applications submitted to a specific
namespace will be handled by the Operator installed in the same namespace. This is achieved by explicitly setting
the sparkJobNamespace parameter to corresponding operator namespace.
KUDO Spark Operator Upgrade Prior to Konvoy Upgrade or Install
Custom Resource Definitions of KUDO Spark Operator versions prior to 3.0.0-1.1.0 do not specify default values for x-kubernetes-list-map-keys properties and will fail validation on Kubernetes versions 1.18.x and later.
Perform these steps prior to upgrading or installing Konvoy to prevent or mitigate disruption of currently-running Spark jobs and invalidating Spark CRDs:
- Wait for the KUDO Spark Operator jobs to finish, or terminate the running jobs.
- Uninstall the KUDO Spark Operator.
- Install the new KUDO Spark version.
- Upgrade or install Konvoy.
Submitting Spark Applications
To submit Spark Application you should have KUDO Spark Operator installed.
In order to deploy a Spark Application to Kubernetes using the KUDO Spark Operator, it should be described as a Kubernetes object. To do that, create a specification in yaml format with all the necessary configuration required for the application.
Let’s take a simple SparkPi application as an example. The yaml specification could be found here: spark-pi.yaml. This example assumes that you installed KUDO spark to the spark namespace.
apiVersion: "sparkoperator.k8s.io/v1beta2"
kind: SparkApplication
metadata:
  name: spark-pi
  namespace: spark
spec:
  type: Scala
  mode: cluster
  image: "mesosphere/spark:spark-3.0.0-hadoop-2.9-k8s"
  imagePullPolicy: Always
  mainClass: org.apache.spark.examples.SparkPi
  mainApplicationFile: "local:///opt/spark/examples/jars/spark-examples_2.12-3.0.0.jar"
  sparkConf:
    "spark.ui.port": "4041"
  sparkVersion: "3.0.0"
  restartPolicy:
    type: Never
  driver:
    cores: 1
    memory: "512m"
    labels:
      version: 3.0.0
    serviceAccount: spark-instance-spark-service-account
  executor:
    cores: 1
    instances: 2
    memory: "512m"
    labels:
      version: 3.0.0
Spark application configuration is placed under spec section including number of executors, number of cores for drivers/executors, amount of memory. There also is a sparkConf section, where you can place configuration parameters in the form of key-value pairs.
The format for the service account name is {spark-operator name}-spark-service-account. If you have installed the spark operator without specifying the instance name, its name will be spark-instance, thus the service account name will need to be spark-instance-spark-service-account.
Creating the application
Submit Spark Application to the operator:
kubectl create -f spark-pi.yaml
List all Spark applications:
kubectl get sparkapplications -n spark
NAME       AGE
spark-pi   1m
Describe the spark-pi application:
kubectl describe sparkapplications spark-pi -n spark
Verify that the application has been created and is currently running:
kubectl get pods -n spark | grep spark-pi
NAME                                  READY   STATUS      RESTARTS   AGE
spark-pi-1571911449587-exec-1         1/1     Running     0          4s
spark-pi-1571911449587-exec-2         1/1     Running     0          4s
spark-pi-driver                       1/1     Running     0          11s
Three spark-pi application pods running: one driver and two executors.
Verify the driver pod has completed successfully:
kubectl logs --tail=20 spark-pi-driver -n spark | grep 'Pi is'
Pi is roughly 3.141644502283289
Configuring Logging
Logging can be configured by placing a custom log4j.properties file to SPARK_CONF_DIR directory.
Spark Operator provides a mechanism for mounting Spark configuration files via K8s ConfigMap objects.
-
Create a
ConfigMapusing the followinglog4j.propertiesas an example:cat <<'EOF'>> log4j.propertieslog4j.rootCategory=DEBUG, console log4j.appender.console=org.apache.log4j.ConsoleAppender log4j.appender.console.target=System.err log4j.appender.console.layout=org.apache.log4j.PatternLayout log4j.appender.console.layout.ConversionPattern=%d{yy/MM/dd HH:mm:ss} %p %c{1}: %m%n EOFkubectl create configmap spark-conf-map --from-file log4j.properties -
Add the following lines to
SparkApplicationspec:apiVersion: "sparkoperator.k8s.io/v1beta2" kind: SparkApplication metadata: name: spark-pi namespace: spark spec: ... sparkConfigMap: spark-conf-map ... executor: javaOptions: "-Dlog4j.configuration=file:/etc/spark/conf/log4j.properties"
The contents of spark-conf-map will be placed under /etc/spark/conf directory for driver and executor pods,
and SPARK_CONF_DIR environment variable will be set to this directory.
Updating the application
Example: increase the number of executors from 2 to 4.
To do so, you need to modify the spec file and update the value of spec.worker.instances.
Save the changes and apply the updated spec:
kubectl apply -f spark-pi.yaml -n spark
Verify the number of executors has changed:
kubectl get pods -n spark | grep spark-pi
spark-pi-1571999377454-exec-1         1/1     Running     0          118s
spark-pi-1571999377454-exec-2         1/1     Running     0          118s
spark-pi-1571999377454-exec-3         1/1     Running     0          117s
spark-pi-1571999377454-exec-4         1/1     Running     0          117s
spark-pi-driver                       1/1     Running     0          2m4s
Delete the application with the following command:
kubectl delete sparkapplication spark-pi -n spark
This will delete all the pods and services related to the application.
Accessing Spark UI
The are a few ways to expose Spark UI for you application.
When an application is submitted to Kubernetes, the operator automatically creates a Service with default type ClusterIP, which can be used to access Spark UI externally.
kubectl get svc -n spark --field-selector metadata.name=spark-pi-ui-svc
NAME                                  TYPE        CLUSTER-IP    EXTERNAL-IP   PORT(S)             AGE
spark-pi-ui-svc                       ClusterIP   10.0.5.197    <none>        4041/TCP            7s
Using Port Forwarding
Port forwarding works in a way that connections made to a local port are forwarded to port of the pod which is running the Spark driver. With this connection in place, you can use your local workstation to access Spark UI which is running in the Driver pod.
Command example:
kubectl port-forward <resource-name> <local-port>:<container-port>
In case with spark-pi application, the command will look like the following:
kubectl port-forward spark-pi-driver 4040:4041 -n spark
Forwarding from 127.0.0.1:4040 -> 4041
Forwarding from [::1]:4040 -> 4041
After that the Spark UI should be available via URL: localhost:4040
Using a Service
It is possible to create a service with special type that will expose our Spark UI globally via cloud network LB.
Service specification can look like the following:
apiVersion: v1
kind: Service
metadata:
  labels:
    app: spark-pi-loadbalancer
  name: spark-pi-loadbalancer
spec:
  type: LoadBalancer
  selector:
    spark-role: driver
  ports:
    - protocol: TCP
      port: 80
      targetPort: 4041
Specifying spark-role: driver as a selector allows the service to target the required pod.
Create the service using kubectl create -f spark-pi-service.yaml -n spark.
Verify spark-pi-loadbalancer service is having an EXTERNAL-IP assigned:
kubectl get svc -n spark --field-selector metadata.name=spark-pi-loadbalancer
NAME                    TYPE           CLUSTER-IP   EXTERNAL-IP                                                               PORT(S)        AGE
spark-pi-loadbalancer   LoadBalancer   10.0.3.19    a55f8bba6615346149d96bf438d87438-1803869262.us-west-2.elb.amazonaws.com   80:31917/TCP   10m
Now you can use a55f8bba6615346149d96bf438d87438-1803869262.us-west-2.elb.amazonaws.com address in your browser to access Spark UI.
If you want to be able to explore an application’s UI after it is finished, consider setting up the Spark History Server.
To set up a complete monitoring solution to be able to visualize and analyze your Spark cluster performance using real-time metrics and dashboards, see Monitoring.
Available Operator Parameters
The complete list of KUDO Spark Parameters can be found under detailed parameter descriptions.
The current parameter set can be retrieved using the kubectl command in conjunction with two additional tools:
To retrieve the current parameters, issue the following command in the terminal with appropriate INSTANCE value set:
INSTANCE=spark-instance;
kubectl get instances -o json | jq ".items[] | select(.metadata.name == \"$INSTANCE\") | .spec.parameters" | yq eval -P > spark-params.yml
The above command generates a file called spark-params.yml with the current values of all the parameters in effect for the spark operator instance.
For more information, see Advanced Configuration.
Updating Operator Parameters
Parameters can be updated using arguments to the KUDO CLI.
Example: Enabling Spark History Server
- Enabling Spark History Server using the KUDO CLI:
kubectl kudo update --instance spark-instance -p enableHistoryServer=true -p historyServerFsLogDirectory=file:///tmp/ -n spark
- Monitor the KUDO Spark deployment plan:
kubectl kudo plan status --instance spark-instance -n spark
- Wait for the deployment plan to have a status of
COMPLETE
When the deployment plan is COMPLETE there should be Spark History Server pod running:
kubectl get pod -l app.kubernetes.io/name=spark-history-server -n spark
NAME                                             READY   STATUS    RESTARTS   AGE
spark-instance-history-server-68f5645c57-5h2g4   1/1     Running   0          31s
Example: Updating parameters providing YAML file with parameters:
To update multiple parameters at once, it is recommended to submit the updated parameters using the KUDO CLI.
See Available Parameters to get the full list of current parameters as a file.
Apply the desired updates in spark-params.yml using the KUDO CLI:
kubectl kudo update --instance=spark-instance -P spark-params.yml -n spark
Wait for the deployment plan to COMPLETE.
Upgrades
Example: Upgrade KUDO Spark Operator from v3.0.0-1.0.1 to v3.0.0-1.1.0
When upgrading, you should understand the mapping between Spark versions and operator versions.
Wait and monitor the deployment plan to become COMPLETE.
Monitoring
KUDO Spark Operator has metrics reporting support, which can be enabled during the installation of the operator. By default, it supports integration with the Prometheus operator.
Prometheus Operator relies on ServiceMonitor kind which describes the set of targets to be monitored.
KUDO Spark Operator configures ServiceMonitors for both the Operator and submitted Spark Applications automatically
when monitoring is enabled.
Exporting Spark Operator and Spark Application metrics to Prometheus
Prerequisites
- KUDO v0.15.0 or later
- The
prometheus-operator. If you do not already have theprometheus-operatorinstalled on your Kubernetes cluster, you can do so by following the quick start guide.
Metrics configuration
Metrics reporting is disabled by default and can be enabled by passing the following parameter to kudo install:
kubectl kudo install spark --instance=spark -p enableMetrics=true
Service endpoints and ServiceMonitor resources are configured to work with Prometheus Operator out of the box.
Full list of metrics configuration parameters and defaults is available in KUDO Spark params.yaml.
Running Spark Application with metrics enabled
-
Composing your Spark Application yaml:
-
use the following Spark image which includes the
JMXPrometheusexporter jar:mesosphere/spark:spark-3.0.0-hadoop-2.9-k8s -
enable Driver and Executors metrics reporting by adding the following configuration into
SparkApplicationspecsection:monitoring: exposeDriverMetrics: true exposeExecutorMetrics: true prometheus: jmxExporterJar: "/prometheus/jmx_prometheus_javaagent-0.11.0.jar" port: 8090spec.momitoring.prometheus.portvalue should be the same for all submitted Spark Applications in order for metrics to be scraped. -
if it is necessary to expose the metrics endpoint on a port other than
8090, do the following:- specify desired port when installing the
kudo-spark-operator:
kubectl kudo install spark -p appMetricsPort=<desired_port>- change the
portvalue in theSparkApplicationyaml definition (spec.monitoring.prometheus.port)
- specify desired port when installing the
-
Mark
driverand, orexecutorwith the labelmetrics-exposed: "true"spec: driver: labels: metrics-exposed: "true" executor: labels: metrics-exposed: "true" -
Install the SparkApplication:
kubectl apply -f <path_to_the_application_yaml>
Full application configuration example is available in spark-application-with-metrics.yaml
-
-
Now, go to the prometheus dashboard (for example,
<kubernetes_endpoint_url>/ops/portal/prometheus/graph) and search for metrics starting withspark. The Prometheus URI might be different depending on how you configured and installed theprometheus-operator.
Dashboards
Dashboard installation:
- Open the Grafana site (for example,
<kubernetes_endpoint_url>/ops/portal/grafana). - Press + button and pick
Importitem from the menu. - Copy content of the dashboard json file and paste it to the text area on importing form.
For more information visit Grafana documentation: Importing a dashboard guide.