
 Kommander Documentation
Kommander allows you to monitor and manage very large numbers of clusters. Use the features described in this area to connect existing clusters, or to create new clusters whose lifecycle is managed by Konvoy. You can view clusters from the Clusters tab in the navigation pane on the left. You can see the details for a cluster by selecting the View Details link at the bottom of the cluster card or the cluster name in either the card or the table view.
Types
There are several types of clusters that display in the Clusters tab. The cluster type appears in the cluster card just under the cluster name.
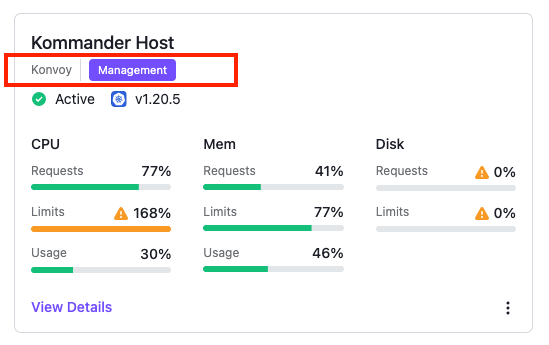
Figure 1. A cluster card with its type highlighted
The type values include:
- Attached: An Attached cluster is one that was not created with Kommander. You cannot manage an Attached cluster’s lifecycle, but you can monitor it.
- Managed: A Managed cluster is a Konvoy cluster that was created with Kommander. You can use Kommander to manage a Managed cluster’s lifecycle.
- Management: This is the Konvoy cluster that hosts Kommander.
Statuses
A cluster card’s status line displays both the current status and the version of Kubernetes running in the cluster.
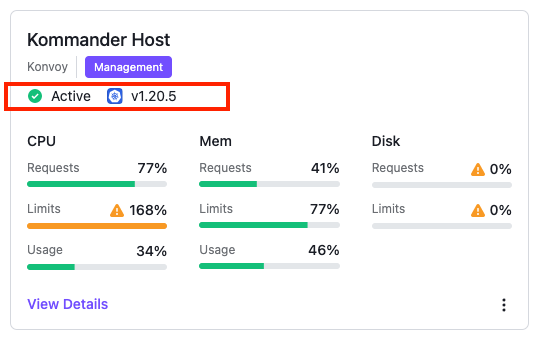
Figure 2. A cluster card with its status highlighted
The status list includes these values:
| Status | Description |
|---|---|
| Pending | This is the initial state when a cluster is created or connected. |
| Pending Setup | The cluster has networking restrictions that require additional setup, and is not yet connected or attached. |
| Loading Data | The cluster has been added to Kommander and details are being fetched about the cluster. This is the status before Active. |
| Active | The cluster is connected to API server. |
| Provisioning* | The cluster is being created on your cloud provider. This process may take some time. To follow the creation progress, select View Logs in the drop-down menu. |
| Joining | The cluster is being joined to the management cluster for federation. |
| Joined | The join process is done, and waiting for the first data from the cluster to arrive. |
| Deleting | The cluster is being deleted. This process may take some time. |
| Error | There has been an error connecting to the cluster or retrieving data from the cluster. |
| Failed* | The cluster has failed to be provisioned. For more info on the failure, select View Logs in the drop-down menu. |
| Join Failed | This status can appear when kubefed does not have permission to create entities in the target cluster. |
| Unjoining | Kubefed is cleaning up after itself, removing all installed resources on the target cluster. |
| Unjoined | The cluster has been disconnected from the management cluster. |
| Unjoin Failed | The Unjoin from kubefed failed or there is some other error with deleting or disconnecting. |
| Deleting | The cluster and its resources are being removed from your cloud provider. Select View Logs in the drop-down menu to follow progress. This process may take some time. |
| Deleted | The cluster and its resources have been removed from your cloud provider. |
| Provisioned* | The cluster has been created on your cloud provider. |
* These statuses only appear on Managed clusters.
Resources
The Resources graphs on a cluster card show you a cluster’s resource requests, limits, and usage. This allows a quick, visual scan of cluster health. Hover over each resource to get specific details for that specific cluster resource.
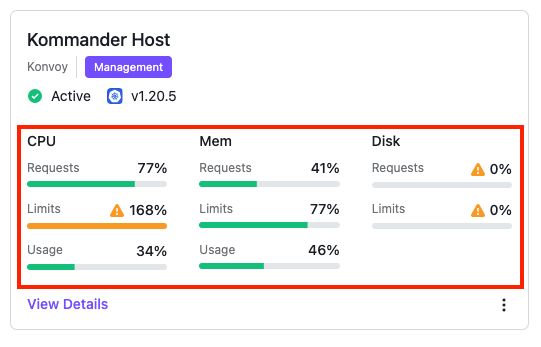
Figure 3. A cluster card with resources highlighted
| Resource | Description |
|---|---|
| CPU Requests | The requested portion of the total allocatable CPU resource for the cluster, measured in number of cores, such 0.5 cores. |
| CPU Limits | The portion of the total allocatable CPU resource to which the cluster is limited, measured in number of cores, such as 0.5 cores. |
| CPU Usage | The amount of the allocatable CPU resource being consumed. Cannot be higher than the configured CPU limit. Measured in number of cores, such as 0.5 cores. |
| Memory Requests | The requested portion of the total allocatable memory resource for the cluster, measured in bytes, such as 64 GiB. |
| Memory Limits | The portion of the allocatable memory resource to which the cluster is limited, measured in bytes, such as 64 GiB. |
| Memory Usage | The amount of the allocatable memory resource being consumed. Cannot be higher than the configured memory limit. Measured in bytes, such as 64 GiB. |
| Disk Requests | The requested portion of the allocatable ephemeral storage resource for the cluster, measured in bytes, such as 64 GiB. |
| Disk Limits | The portion of the allocatable ephemeral storage resource to which the cluster is limited, measured in bytes, such as 64 GiB. |
For more detailed information, see the Kubernetes documentation about resources.
Platform services
Platform services, formerly called Addons, are services that the management cluster installs. You can visit a cluster’s detail page to see which platform services are enabled under the “Platform Services” section.
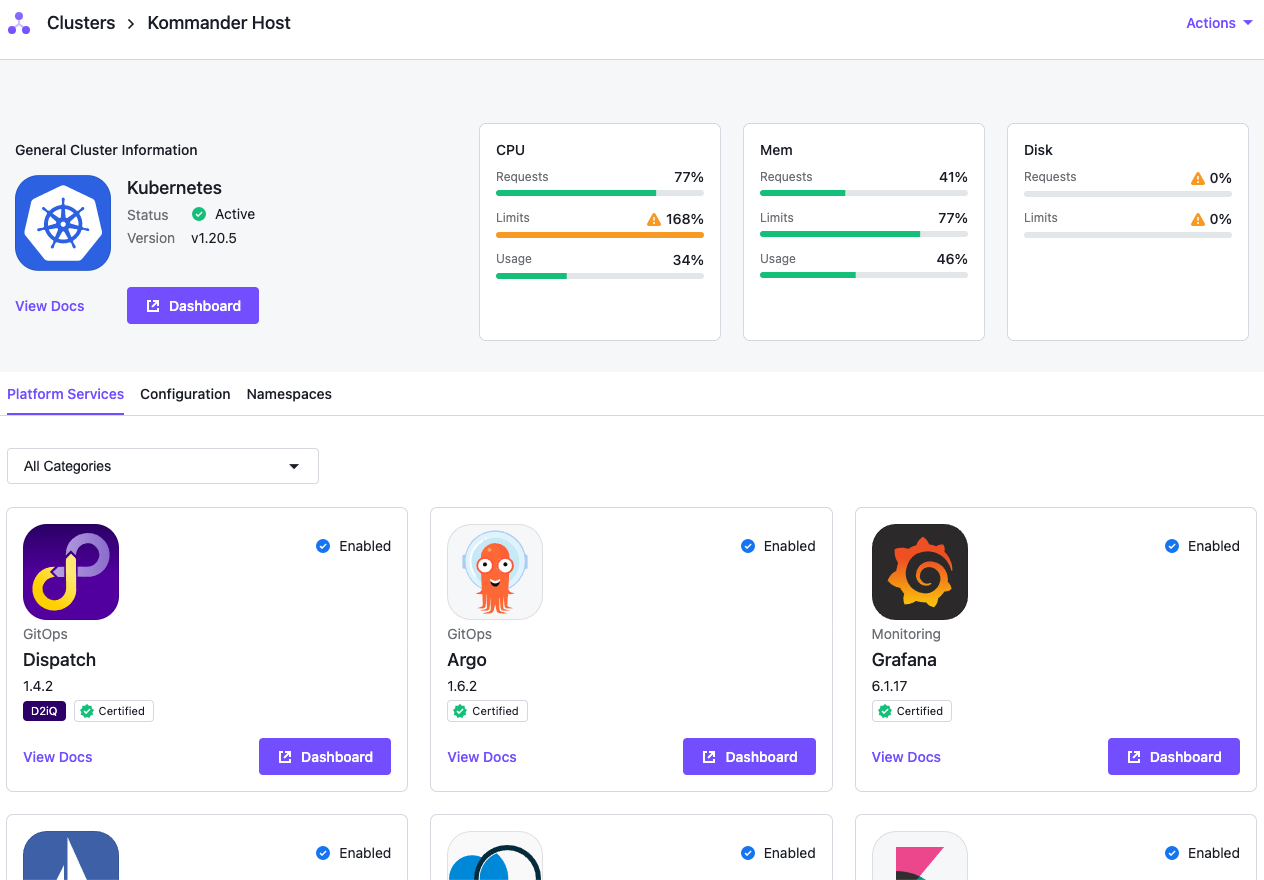 Figure 4. Cluster detail page
Review the workspace platform service resource requirements to ensure that the attached clusters have sufficient resources. For more information on platform services and how to customize them, see workspace platform services.
Custom service cards
Custom service cards can be added to the cluster detail page’s Platform Services section by creating a ConfigMap on the cluster. The ConfigMap must have a d2iq.io/addon label and must contain both name and dashboardLink data keys to be displayed. Upon creation of the ConfigMap, the Kommander UI will display a card corresponding to the data provided in the ConfigMap. Custom service cards have a Kubernetes icon and can link to a service running in the cluster, or use an absolute URL to link to any accessible URL.
ConfigMap example
apiVersion: v1
kind: ConfigMap
metadata:
  name: "my-service"
  namespace: "kommander"
  labels:
    "d2iq.io/addon": "my-service"
data:
  name: "My Service"
  dashboardLink: "/path/to/service"
| Key | Description | Required |
|---|---|---|
| metadata.labels.“d2iq.io/addon” | The platform service name (ID). | X |
| data.name | The display name used to describe the service and that will display on the custom service card in the user interface. | X |
| data.dashboardLink | The link to the service. This can be an absolute link, “https://www.d2iq.com,” or a relative link, “/ops/portal.” If a relative link is used, the link is built using the cluster’s path as the base of the URL to the service. | X |
| data.docsLink | Link to documentation about the service. This is displayed on the service card, but omitted if not present. | |
| data.category | Category with which to group the custom service. If not provided, the service is grouped under the category, “None.” | |
| data.version | A version string for the service. If not provided, “N/A” is displayed on the service card in the user interface. |
Use a command similar to this one to create a new custom service ConfigMap:
$ cat <<EOF | kubectl apply -f -
apiVersion: v1
kind: ConfigMap
metadata:
  name: "my-service"
  namespace: "kommander"
  labels:
    "d2iq.io/addon": "my-service"
data:
  name: "My Service"
  dashboardLink: "/path/to/service"
EOF
Attach Cluster using tunnel
Using the CLI to attach a Kubernetes Cluster using a Tunnel…Read More
Attach an Existing Kubernetes Cluster
A guide for attaching an existing Kubernetes cluster using kubeconfig…Read More
Creating Konvoy Clusters on AWS
A guide for creating Konvoy clusters on AWS…Read More
Creating Konvoy Clusters on Azure
A guide for creating Konvoy clusters on Azure…Read More
Creating Konvoy Clusters on Premises
A guide for creating Konvoy clusters on your own premises' infrastructure…Read More
Creating or Connecting Clusters
Create or connect a Kubernetes cluster…Read More
Disconnect or Delete Clusters
Disconnect or delete a cluster…Read More
Editing Clusters
Edit a cluster…Read More
Upgrade Kubernetes version
Upgrade the Kubernetes version on a cluster…Read More