
 Kommander Documentation
KUDO Cassandra
Kommander Catalog adds integration for KUDO Cassandra Operator, which simplifies day 2 operations of Apache Cassandra.
KUDO Introduction
Kubernetes Universal Declarative Operator (KUDO) provides a declarative approach to building production-grade Kubernetes operators.
- KUDO is built to help manage day 2 operations of services on Kubernetes, including stateful services, through the management of operators.
- KUDO is built to support upgrades of services along with backup, recovery, and the needs of observability.
- KUDO is integrated into Kommander and does not require any initialization via the KUDO CLI
The following articles give an overview of KUDO:
It is strongly recommended to view the KUDO Cassandra Documentation which covers the KUDO Cassandra Operator in-depth. This document covers the integration aspects of KUDO Cassandra Operator with D2iQ Kommander.
Kommander Catalog
KUDO Cassandra is located in the Kommander Catalog. To access the catalog:
- Create a Workspace
- Attach a Cluster to the Workspace
- Create a Project in the Workspace
- Select the created Project
- View the available Platform Services in the Project Catalog
- Select the version you’d like to deploy from the version drop-down, and then select Deploy.
Installation
From the Project Catalog select the desired version of Cassandra and click Deploy.
Below is an example of what should appear in the Kommander UI. The dialog is populated with sensible defaults:
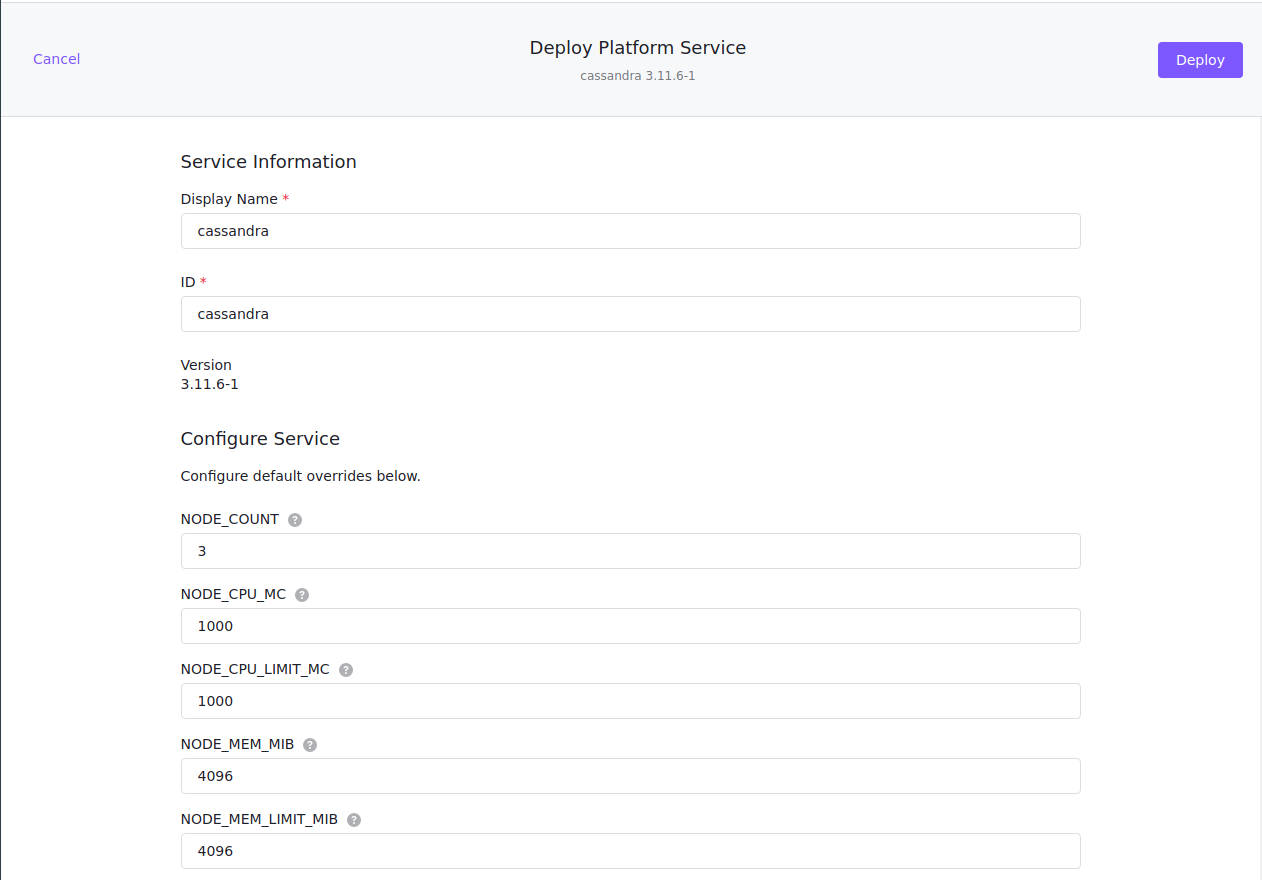
- The ID field above is referred to as the Cassandra
instanceby KUDO. - Detailed parameter descriptions and defaults are available for each version of KUDO Cassandra Operator, in this case version
3.11.7-1
Select Deploy to install Cassandra.
- Kommander will proceed to install
kudo-controller-managerin thekudo-systemnamespace if it does not already exist. This is the equivalent of issuingkubectl kudo initmanually on the CLI. - KUDO will then install Cassandra in the Project namespace created using Kommander.
- The deployment progression can be viewed by looking at the
deployplan.
KUDO Cassandra Service Status
The Operator Plan Status provides an overview of the service.
At this point it is useful to have an understanding of KUDO Operator Plans and the KUDO CLI should be installed.
- Get the instances running in the project namespace.
Here we have cassandra installed in the Kommander Project test-project with namespace test-project-zc6tc.
$ kubectl kudo get instances -n test-project-zc6tc
List of current installed instances in namespace "test-project-zc6tc":
.
└── cassandra
- Get the Plan status from the KUDO Cassandra Operator.
Here is a status summary of all plans after installation in the KUDO Cassandra Operator
$ kubectl kudo plan status --instance cassandra -n test-project-zc6tc
Plan(s) for "cassandra" in namespace "test-project-zc6tc":
.
└── cassandra (Operator-Version: "cassandra-1.0.0" Active-Plan: "deploy")
    ├── Plan backup (serial strategy) [NOT ACTIVE]
    │   └── Phase backup (serial strategy) [NOT ACTIVE]
    │       ├── Step cleanup [NOT ACTIVE]
    │       └── Step backup [NOT ACTIVE]
    ├── Plan deploy (serial strategy) [COMPLETE], last updated 2021-03-25 01:50:31
    │   ├── Phase rbac (parallel strategy) [COMPLETE]
    │   │   └── Step rbac-deploy [COMPLETE]
    │   └── Phase nodes (serial strategy) [COMPLETE]
    │       ├── Step pre-node [COMPLETE]
    │       └── Step node [COMPLETE]
    └── Plan repair (serial strategy) [NOT ACTIVE]
        └── Phase repair (serial strategy) [NOT ACTIVE]
            ├── Step cleanup [NOT ACTIVE]
            └── Step repair [NOT ACTIVE]
- A
deployplan status ofCOMPLETEindicates that KUDO Cassandra has deployed successfully and is healthy.
If any issues are encountered during the above, refer to the Troubleshooting section.
Available Parameters
The complete list of KUDO Cassandra Parameters can be found under detailed parameter descriptions.
The current parameter set can be retrieved using the kubectl command in conjunction with two additional tools:
To retrieve the current parameters, issue the following command in the terminal with appropriate INSTANCE value set:
INSTANCE=cassandra;
kubectl get instances -o json | jq ".items[] | select(.metadata.name == \"$INSTANCE\") | .spec.parameters" | yq -e --yaml-output '.' > cassandra-params.yml
The above command generates a file called cassandra-params.yml with the current values of all the parameters in effect for the cassandra instance.
Updating Parameters
Parameters can be updated using arguments to the KUDO CLI.
Example: Increasing Cassandra node counts
- Increase the number of nodes using the KUDO CLI:
kubectl -n test-project-zc6tc kudo update --instance cassandra -p NODE_COUNT=4
- Monitor the KUDO Cassandra deployment plan:
kubectl kudo plan status --instance cassandra -n test-project-zc6tc
- Wait for the deployment plan to have a status of
COMPLETE
When the deployment plan is COMPLETE there should be 4 nodes as seen by the number of pods running:
kubectl get pods -n test-project-zc6tc
NAME               READY   STATUS    RESTARTS   AGE
cassandra-node-0   1/1     Running   0          62m
cassandra-node-1   1/1     Running   0          62m
cassandra-node-2   1/1     Running   0          61m
cassandra-node-3   1/1     Running   0          8m13s
Example: Updating multiple parameters:
To update multiple parameters at once, it is recommended to submit the updated parameters using the KUDO CLI.
See Available Parameters to get the full list of current parameters as a file.
Apply the desired updates in cassandra-params.yml using the KUDO CLI:
kubectl kudo update -n test-project-zc6tc --instance=cassandra -P cassandra-params.yml
Wait for the deployment plan to COMPLETE as shown in the Cassandra node counts example.
Upgrades
KUDO Cassandra versions can be upgraded using the KUDO CLI.
Example Upgrade KUDO Cassandra from v3.11.6-1.0.1 to v3.11.7-1.0.2:
When upgrading, you should understand the mapping between Cassandra versions and operator versions.
For more information, see the table at the end of the Cassandra operator
Wait and monitor the deployment plan to become COMPLETE.
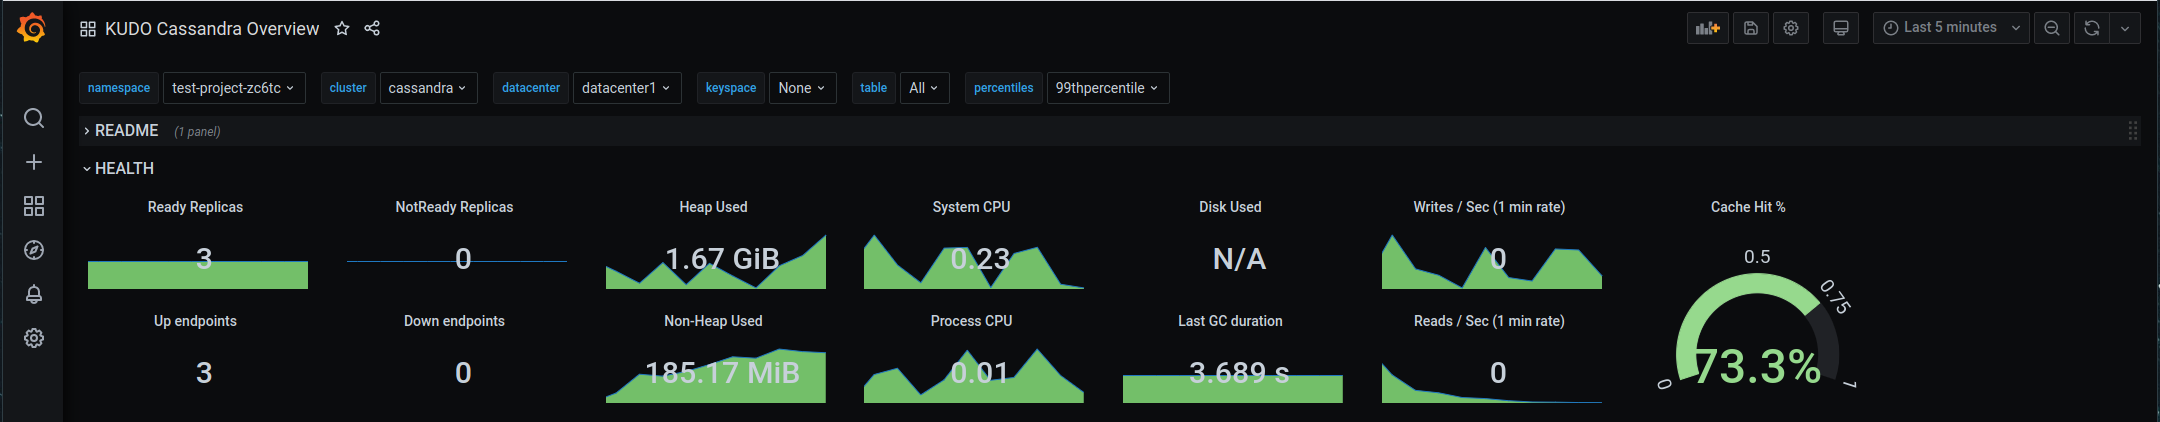
Monitoring
Kommander includes Prometheus and Grafana as part of the federated Workspace Platform Services along with Centralized Monitoring.
KUDO Cassandra operator can export metrics to Prometheus, to do so set the PROMETHEUS_EXPORTER_ENABLED parameter to true:
kubectl kudo update -p PROMETHEUS_EXPORTER_ENABLED=true --instance cassandra -n test-project-zc6tc
- A prometheus-exporter container will run in the same pod as every Cassandra node container. It will listen for connections on
PROMETHEUS_EXPORTER_PORT, which is set to7200by default. - A prometheus-exporter-port will be added to the KUDO Cassandra operator
Service. - A
ServiceMonitorwill be created to make Prometheus poll that port for metrics.
Sample Grafana Dashboards can be found in the monitoring directory.
Grafana dashboards can be imported or recurring dashboards can be defined inline for Kommander to import through adding custom dashboards.
External Access
The KUDO Cassandra operator supports creation of a service that opens up ports to access Cassandra from outside the cluster. To enable this, you have to set one or more of the following variables:
kubectl kudo update cassandra -n test-project-zc6tc -p EXTERNAL_NATIVE_TRANSPORT=true
This will create a service with a LoadBalancer port that forwards to the Cassandra nodes.
The following options are available:
EXTERNAL_NATIVE_TRANSPORT="true"- Enable access to the cluster from the outsideEXTERNAL_RPC="true"- Enable access to the legacy RPC port if it is enabled on the cluster (Requires that START_RPC is “true”)EXTERNAL_NATIVE_TRANSPORT_PORT="9042"- The external port that is forwarded to the native transport port on the nodesEXTERNAL_RPC_PORT="9160"- The external port that is forwarded to the RPC port on the nodesEXTERNAL_SERVICE_ANNOTATIONS- Annotations that are added to the external service. For example, this can be used to configure ExternalDNS access
Backup & Repair
KUDO Cassandra provides the ability to perform a full backup and restore to AWS S3.
Backup and Restore is detailed in the KUDO Cassandra Operator documentation.
Decommissioning KUDO Cassandra Nodes
KUDO Cassandra does not provide an automated way to scale down the Cassandra cluster, as this is a critical operation that should not be repeated frequently, and to discourage anti-patterns when managing an Apache Cassandra cluster.
KUDO Cassandra only supports decommissioning the node with the highest pod ordinal index. For example, when having a cluster with following pods:
NAME               READY   STATUS    RESTARTS   AGE
cassandra-node-0   1/1     Running   0          62m
cassandra-node-1   1/1     Running   0          62m
cassandra-node-2   1/1     Running   0          61m
cassandra-node-3   1/1     Running   0          8m13s
We can only decommission cassandra-node-3 as it has the highest pod ordinal index 3.
Decommission the node
kubectl exec -it pod/cassandra-node-3 \
        -n test-project-zc6tc \
        -c cassandra \
        -- \
        nodetool decommission
Once the operation is completed, we can update the KUDO Cassandra Instance
kubectl kudo update -p NODE_COUNT=3 --instance cassandra -n test-project-zc6tc
Once the update plan is complete, you should delete (or clean) the PVC that was attached to the KUDO Cassandra pod/cassandra-node-3. Failing to delete or clean the PVC will result in issues when scaling the cluster up next time.
Troubleshooting
KUDO provides the ability to collect logs and other diagnostics data for debugging and for bug-reports.
kubectl kudo diagnostics collect --instance cassandra -n test-project-zc6tc
The diagnostics data contains the following:
KUDO Environment
- Installed Manager and its logs.
- Service account and services.
Data for the specified Operator
- The Operator, OperatorVersion and Instance resources.
- Deployed resources from the operator.
- Logs from deployed pods
To monitor all the events occurring in the namespace, its helpful to look at event log:
kubectl get events -w -n test-project-zc6tc