
 Kommander Documentation
Kibana overview
Kibana is an free and open frontend application that sits on top of the Elastic Stack, providing search and data visualization capabilities for data indexed in Elasticsearch. Commonly known as the charting tool for the Elastic Stack (previously referred to as the ELK Stack after Elasticsearch, Logstash, and Kibana), Kibana also acts as the user interface for monitoring, managing, and securing an Elastic Stack cluster, and as the centralized hub for built-in solutions developed on the Elastic Stack.
Kommander catalog
Kommander catalog adds integration for Elasticsearch in Helm-based drivers
To access the catalog:
- Create a Workspace
- Attach a Cluster to the Workspace
- Create a Project in the Workspace
- Select the created Project
- View the available Platform Services in the Project Catalog
- Select the version you’d like to deploy from the version drop-down, and then select Deploy.
Install
From the Project Catalog select the desired version of Elasticsearch, and select Deploy.
The Kommander UI should resemble the following image. The dialog is populated with appropriate defaults:
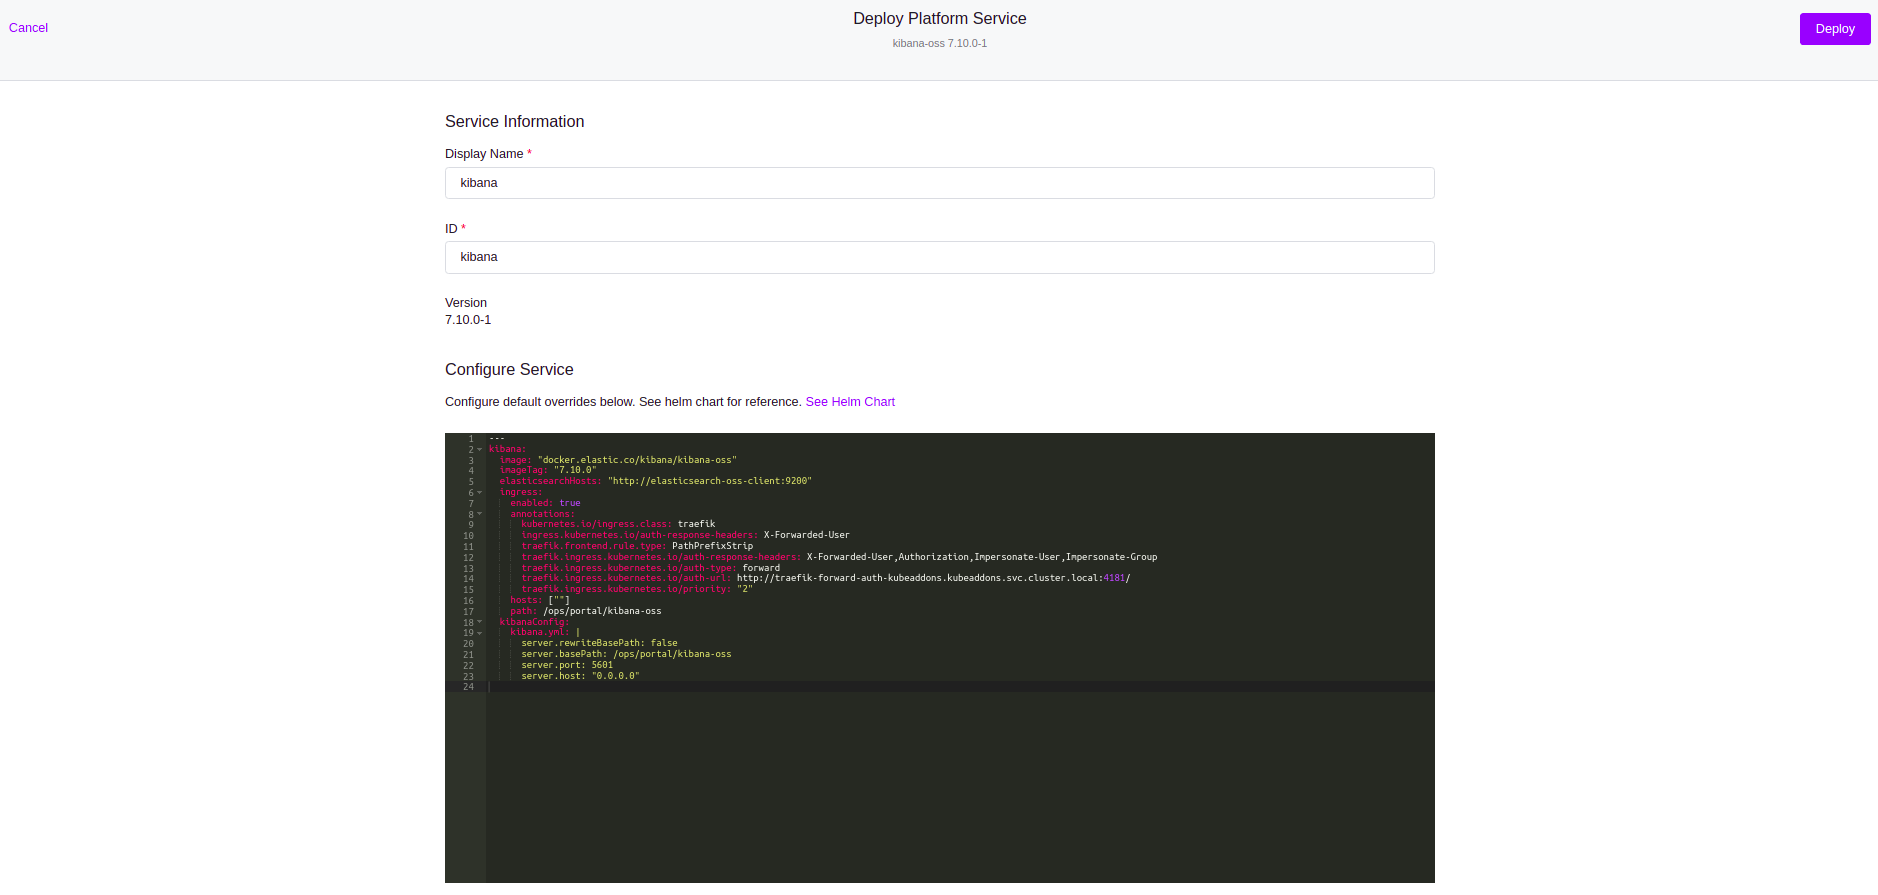
- The kibana.elasticsearchHosts should point to the Elasticsearch client node.
You will see the following pods under the project namespace on the Kubernetes cluster (assuming elasticsearch service is already running):
kubectl get pods
NAME                                                              READY   STATUS    RESTARTS   AGE
elasticsearch-oss-client-0                                        1/1     Running   0          21m
elasticsearch-oss-data-0                                          1/1     Running   0          21m
elasticsearch-oss-data-1                                          1/1     Running   0          21m
elasticsearch-oss-data-2                                          1/1     Running   0          21m
elasticsearch-oss-master-0                                        1/1     Running   0          21m
elasticsearch-oss-master-1                                        1/1     Running   0          21m
elasticsearch-oss-master-2                                        1/1     Running   0          21m
kibana-kubeaddons-kibana-65f88487c8-t28td                         1/1     Running   0          71s
Parameters
The Kommander Catalog Kibana Platform Service creates an ensemble of the upstream Kibana Helm Chart
Full list of Configuration Parameters that can be applied to Kibana Platform Service.
The current set of default parameters applied can be found in this file.
Services Exposed
The following services are exposed by Elasticsearch and Kibana.
kubectl get svc
NAME                                                       TYPE        CLUSTER-IP    EXTERNAL-IP   PORT(S)             AGE
elasticsearch-oss-client                                   ClusterIP   10.0.50.166   <none>        9200/TCP,9300/TCP   33m
elasticsearch-oss-client-headless                          ClusterIP   None          <none>        9200/TCP,9300/TCP   33m
elasticsearch-oss-data                                     ClusterIP   10.0.19.66    <none>        9200/TCP,9300/TCP   33m
elasticsearch-oss-data-headless                            ClusterIP   None          <none>        9200/TCP,9300/TCP   33m
elasticsearch-oss-ingest                                   ClusterIP   10.0.61.113   <none>        9200/TCP,9300/TCP   33m
elasticsearch-oss-ingest-headless                          ClusterIP   None          <none>        9200/TCP,9300/TCP   33m
elasticsearch-oss-master                                   ClusterIP   10.0.28.71    <none>        9200/TCP,9300/TCP   33m
elasticsearch-oss-master-headless                          ClusterIP   None          <none>        9200/TCP,9300/TCP   33m
kibana-kubeaddons-kibana                                   ClusterIP   10.0.33.80    <none>        5601/TCP            13m