
 Kommander Documentation
Elasticsearch overview
Elasticsearch is a distributed, RESTful search and analytics engine capable of addressing a growing number of use cases. As the core of the Elastic Stack, Elasticsearch centrally stores your data for lightning fast search, fine‑tuned relevancy, and powerful analytics that scale with ease.
Kommander catalog
Kommander catalog adds integration for Elasticsearch in Helm-based drivers
To access the catalog:
- Create a Workspace
- Attach a Cluster to the Workspace
- Create a Project in the Workspace
- Select the created Project
- View the available Platform Services in the Project Catalog
- Select the version you’d like to deploy from the version drop-down, and then select Deploy.
Install
From the Project Catalog select the desired version of Elasticsearch, and select Deploy.
The Kommander UI should resemble the following image. The dialog is populated with appropriate defaults:
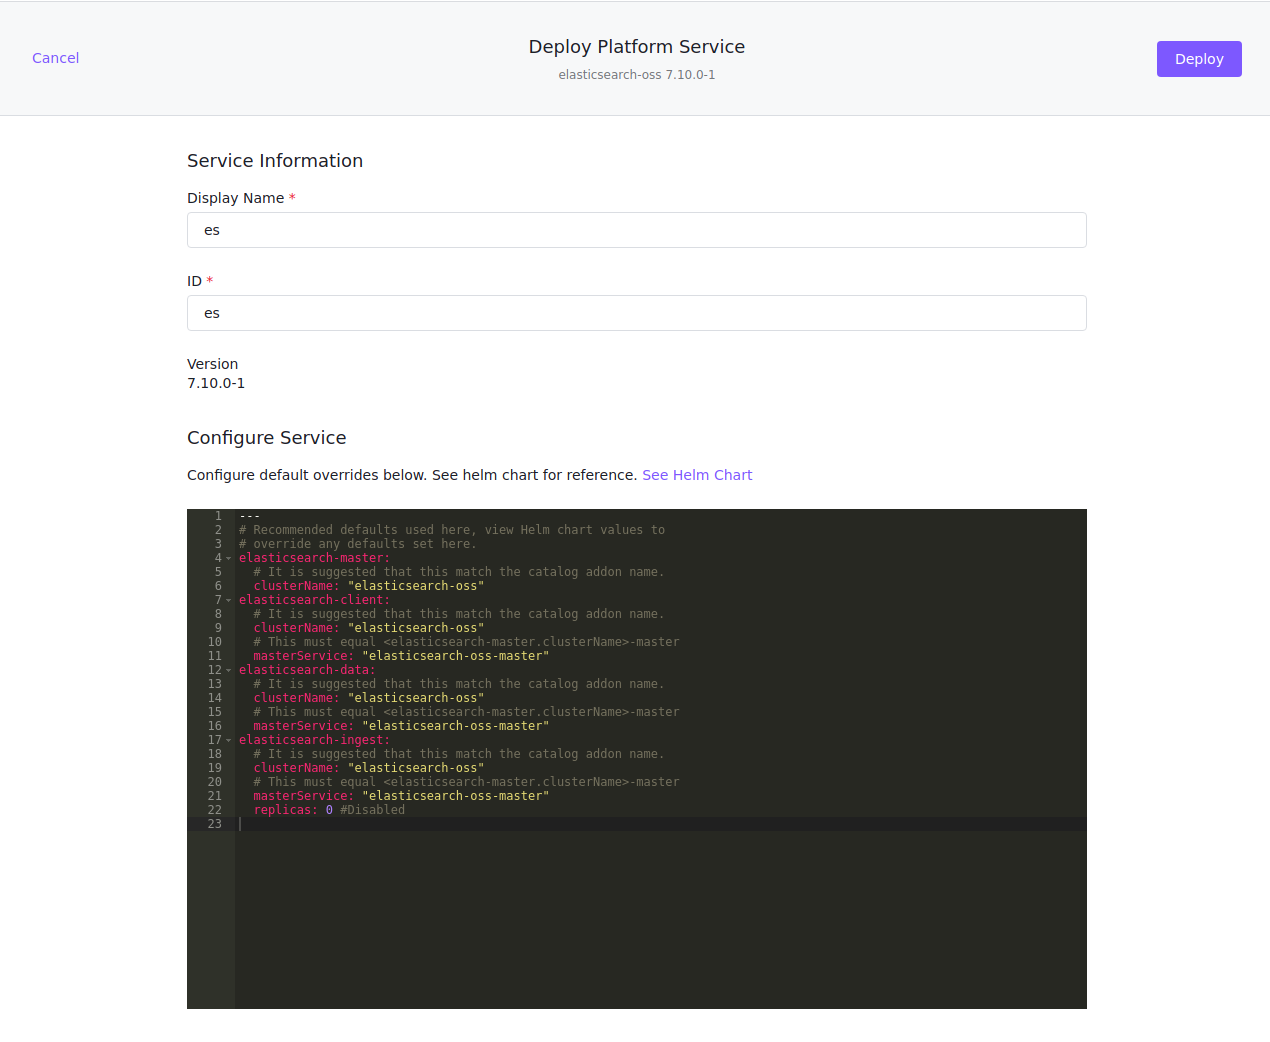
- The clusterName field above is used by Kibana and other components to refer to Elasticsearch.
With the included defaults, an Elasticsearch cluster with the following topology is created:
- 1 - Client Node
- 3 - Master Nodes
- 3 - Data Nodes
You will see the following pods under the project namespace on the Kubernetes cluster:
kubectl get pods
NAME                         READY   STATUS    RESTARTS   AGE
elasticsearch-oss-client-0   1/1     Running   0          69m
elasticsearch-oss-data-0     1/1     Running   0          69m
elasticsearch-oss-data-1     1/1     Running   0          69m
elasticsearch-oss-data-2     1/1     Running   0          69m
elasticsearch-oss-master-0   1/1     Running   0          69m
elasticsearch-oss-master-1   1/1     Running   0          69m
elasticsearch-oss-master-2   1/1     Running   0          69m
Each of the above nodes correspond to the following Elastic Node Roles
Parameters
The Kommander Catalog Elasticsearch Platform Service creates an ensemble of the upstream Elastic Helm Chart
Full list of Configuration Parameters that can be applied to any of the current node roles:
The current set of default parameters applied can be found in this file.
Update parameters
Update parameters by directly modifying them in the Kommander Catalog UI:
Example: Increasing Data Node Replicas from the default to 4.
-
Select
Edit Servicefor the selected Elasticsearch instance. -
Modify
elasticsearch-datato include the updatedreplicascount, as seen below:elasticsearch-data: # It is suggested that this match the catalog addon name. clusterName: "elasticsearch-oss" # This must equal <elasticsearch-master.clusterName>-master masterService: "elasticsearch-oss-master" replicas: 4 -
Select
SaveThe output below shows that we now have 4 data nodes.
kubectl get podsNAME READY STATUS RESTARTS AGE elasticsearch-oss-client-0 1/1 Running 0 70m elasticsearch-oss-data-0 1/1 Running 0 70m elasticsearch-oss-data-1 1/1 Running 0 70m elasticsearch-oss-data-2 1/1 Running 0 70m elasticsearch-oss-data-3 1/1 Running 0 2m8s elasticsearch-oss-master-0 1/1 Running 0 70m elasticsearch-oss-master-1 1/1 Running 0 70m elasticsearch-oss-master-2 1/1 Running 0 70m
Monitoring
Kommander includes Prometheus and Grafana as part of the federated Workspace Platform Services along with centralized monitoring.
The Kommander Catalog includes Elasticsearch-Exporter to be used in conjunction with Elasticsearch to export metrics to Prometheus and Grafana.
External access
The Kommander Catalog includes Kibana which provides a graphical way to view data stored in Elasticsearch
The following services are exposed by Elasticsearch:
kubectl get services
NAME                                TYPE        CLUSTER-IP    EXTERNAL-IP   PORT(S)             AGE
elasticsearch-oss-client            ClusterIP   10.0.30.140   <none>        9200/TCP,9300/TCP   91m
elasticsearch-oss-client-headless   ClusterIP   None          <none>        9200/TCP,9300/TCP   91m
elasticsearch-oss-data              ClusterIP   10.0.5.4      <none>        9200/TCP,9300/TCP   91m
elasticsearch-oss-data-headless     ClusterIP   None          <none>        9200/TCP,9300/TCP   91m
elasticsearch-oss-ingest            ClusterIP   10.0.29.173   <none>        9200/TCP,9300/TCP   91m
elasticsearch-oss-ingest-headless   ClusterIP   None          <none>        9200/TCP,9300/TCP   91m
elasticsearch-oss-master            ClusterIP   10.0.48.163   <none>        9200/TCP,9300/TCP   91m
elasticsearch-oss-master-headless   ClusterIP   None          <none>        9200/TCP,9300/TCP   91m
Elasticsearch provides comprehensive REST API
The following example shows how to query the Elasticsearch REST API:
-
Port-forward the elasticsearch-client service:
kubectl port-forward service/elasticsearch-oss-client 9200:9200 &Forwarding from 127.0.0.1:9200 -> 9200 Forwarding from [::1]:9200 -> 9200 Handling connection for 9200 -
Elasticsearch should be ready to receive requests:
$ curl -s http://127.0.0.1:9200 | jq { "name": "elasticsearch-oss-client-0", "cluster_name": "elasticsearch-oss", "cluster_uuid": "TLAr4CMwSBKb2e45dHUwgQ", "version": { "number": "7.10.0", "build_flavor": "oss", "build_type": "docker", "build_hash": "51e9d6f22758d0374a0f3f5c6e8f3a7997850f96", "build_date": "2020-11-09T21:30:33.964949Z", "build_snapshot": false, "lucene_version": "8.7.0", "minimum_wire_compatibility_version": "6.8.0", "minimum_index_compatibility_version": "6.0.0-beta1" }, "tagline": "You Know, for Search" } -
As an example, query the Cluster REST API
curl -s http://127.0.0.1:9200/_nodes/_master | jq
{
"_nodes": {
    "total": 1,
    "successful": 1,
    "failed": 0
},
"cluster_name": "elasticsearch-oss",
"nodes": {
    "7HxKd320QnGnimu9ldny7A": {
    "name": "elasticsearch-oss-master-0",
    "transport_address": "192.168.110.153:9300",
    "host": "192.168.110.153",
    "ip": "192.168.110.153",
    "version": "7.10.0",
    "build_flavor": "oss",
    [...output omitted...]
        }
    }
}
Troubleshooting
To troubleshoot deployments, look for issues in the following:
-
Ensure
clusterNameandmasterServicefields are consistent across all node-roles. -
Look for crash-looping pods and inspect their logs.
watch kubectl get pods -
Monitor all the events occurring in the namespace, this can help detect common issues such as insufficient resources on the cluster to start various pods.
kubectl get events -w -n <namespace>