
 DC/OS Documentation
The Nodes section provides a comprehensive view of all of the nodes that are used across your cluster. There are two tabs for this screen, Agents and Masters. By default, you will see the Agents tab.
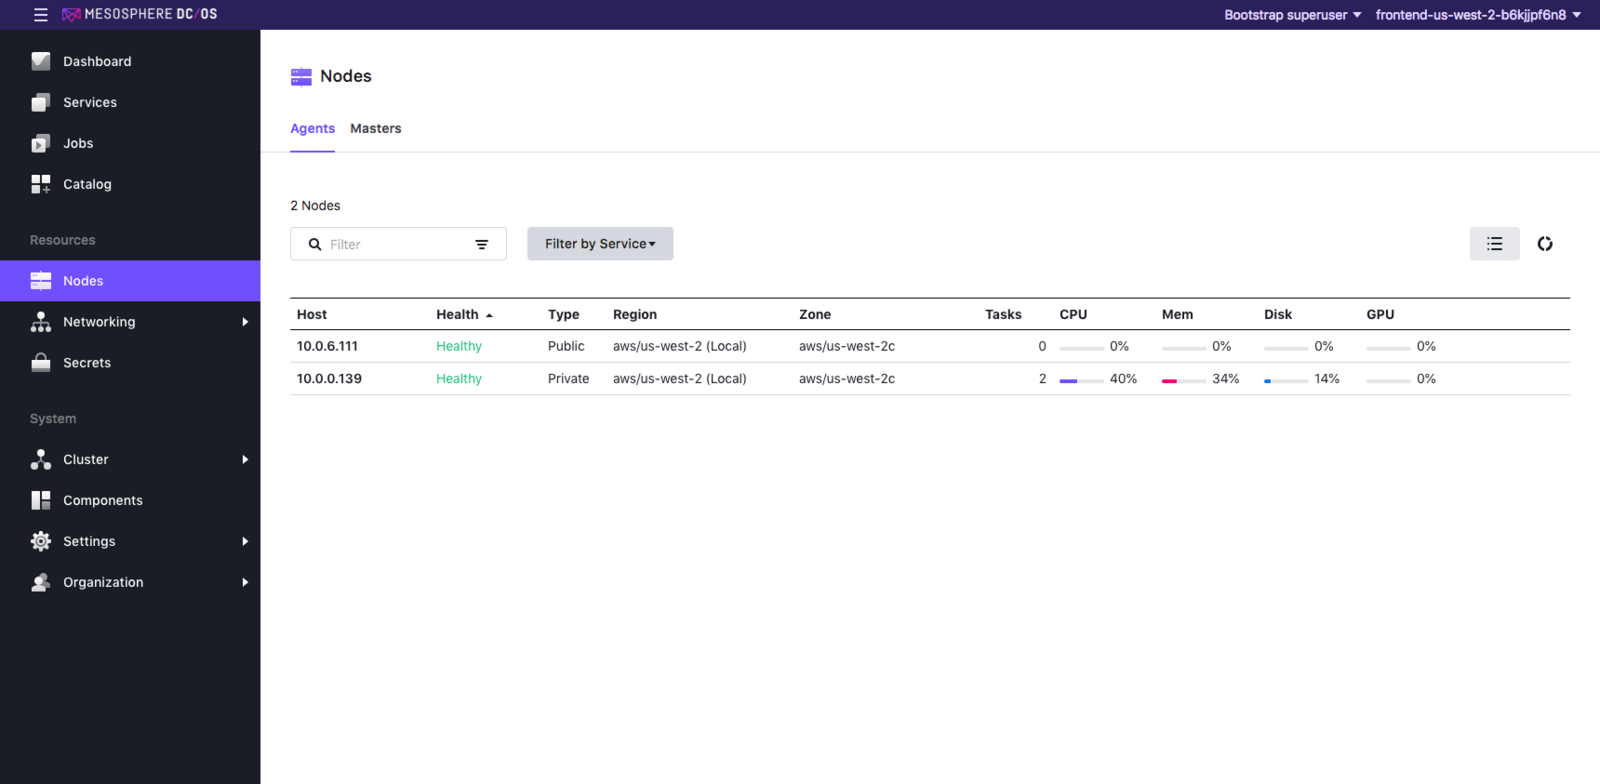
Figure 1 - Agents tab
Agents tab
This is the default view. Also by default, all of your nodes are displayed in List view, sorted by health. You can filter this list by framework or service name.
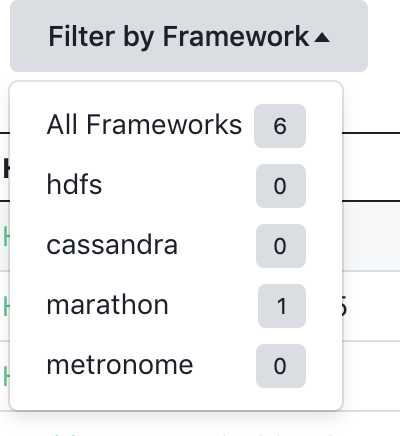
Figure 2 - Filter by framework
If you prefer a more graphical display, click on the icons on the right side of the screen to switch between a list and “donuts” view of the nodes.
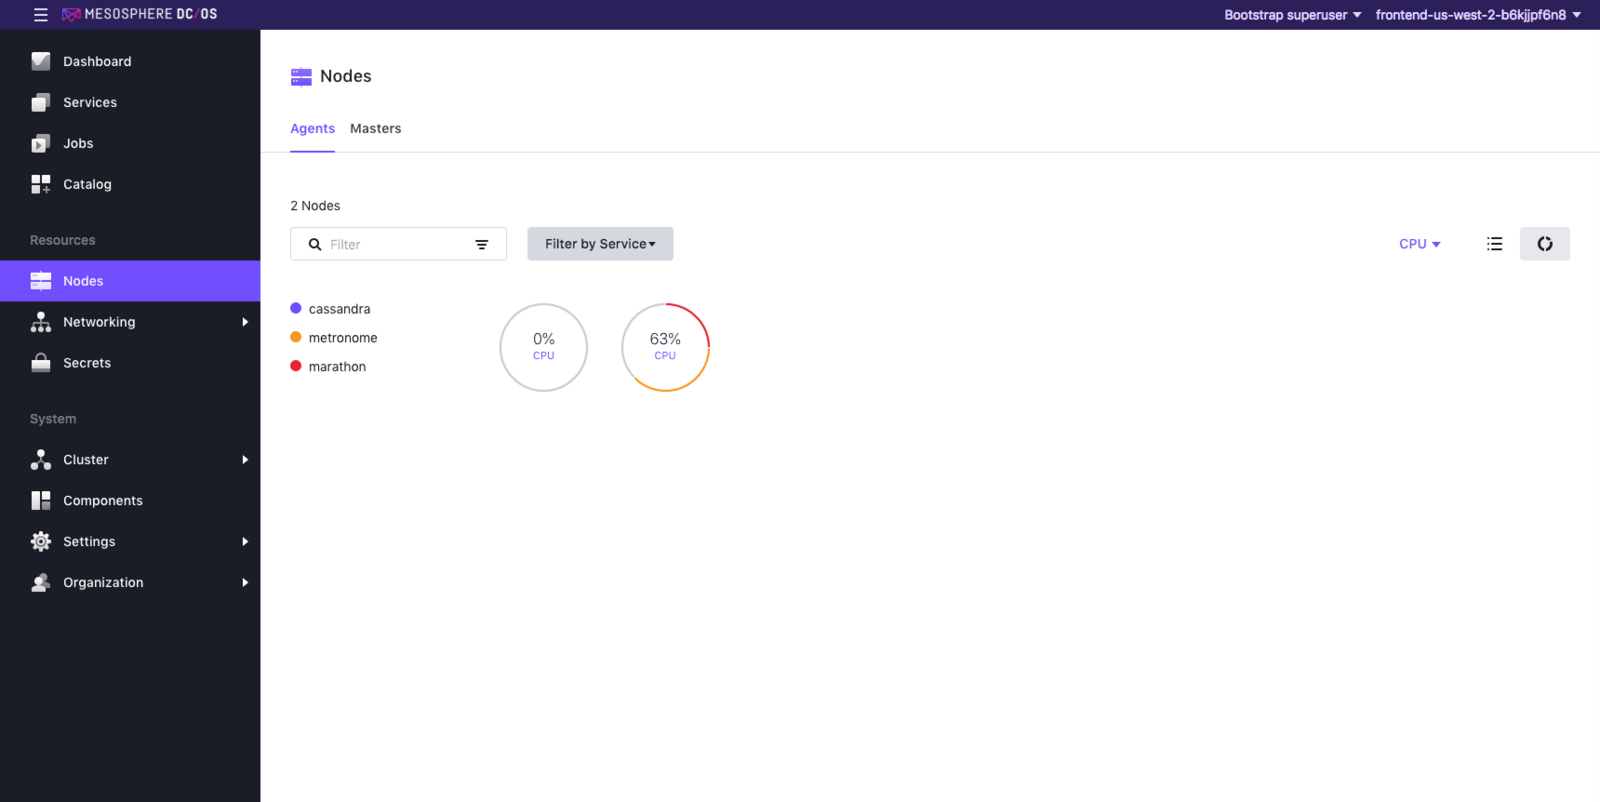
Figure 3 - Nodes “donut” view
Masters tab
The Masters tab displays information about the masters in the cluster. You can see the leader and non-leaders in the cluster, with their corresponding IP and port, region, version, started time, and elected time.
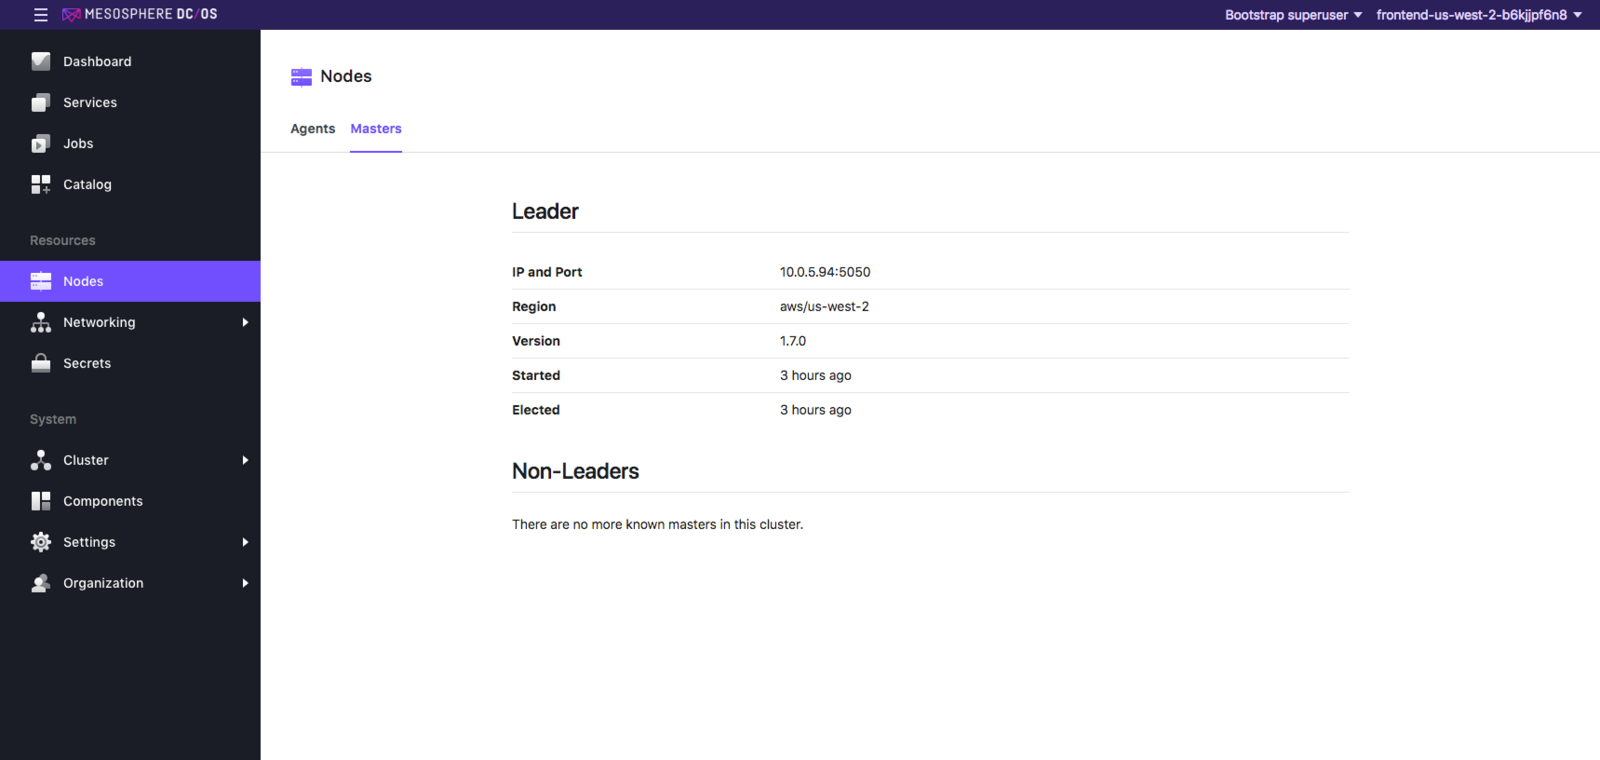
Figure 4 - Masters tab
Nodes instance
Clicking on a Host IP opens a Nodes instance page, which provides more information about the node. You can use the Search box or the drop down filter to narrow your list. The Nodes instance page has three tabs: Tasks, Health, and Details. The Tasks tab is displayed by default.
Tasks
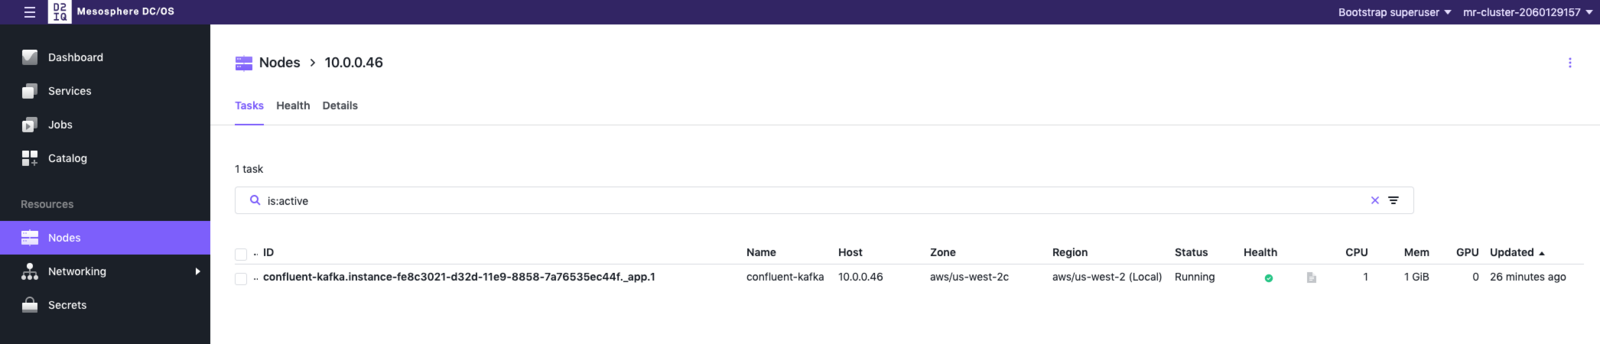
Figure 5 - Tasks tab
The Tasks tab displays the following information:
| Name | Description |
|---|---|
| ID | Unique identifier for this instance of a service. Consists of the name of the service (for example, confluent-kafka plus configuration details.) |
| Name | Unique name of this instance of a service. Consists of a series of words separated by dashes (for example, data-science-engine). Each word must be at least 1 alphanumeric character and may only contain digits (0-9), dashes (-), dots (.), and lowercase letters (a-z). The word may not begin or end with a dash. |
| Host | IP address of this node. |
| Zone | Cloud provider zone. |
| Region | Cloud provider region. If left undefined this will run in your local region. |
| Status | The current state of the node. |
| Health | The current health of the node. |
| Logs | Clicking on the “View Logs” icon will open the logs for this instance of the service. |
| CPU | The number of CPU shares allocated to the process. |
| Mem | The amount of memory, in MB, allocated to the process. |
| GPU | Number of GPUs available to this node. |
| Updated | Time, in minutes, since last update. |
A vertical line of dots in the upper right corner opens a menu which allows you to drain or deactivate a node.
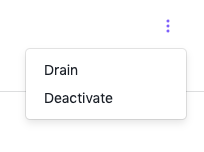
Figure 6 - Deactivation menu
For more information on draining nodes, see Draining a Node. For more information on deactivating a node, see the documentation on how to Shut Down and Decomission Nodes.
Health
The Health tab displays the status of your node’s health checks.
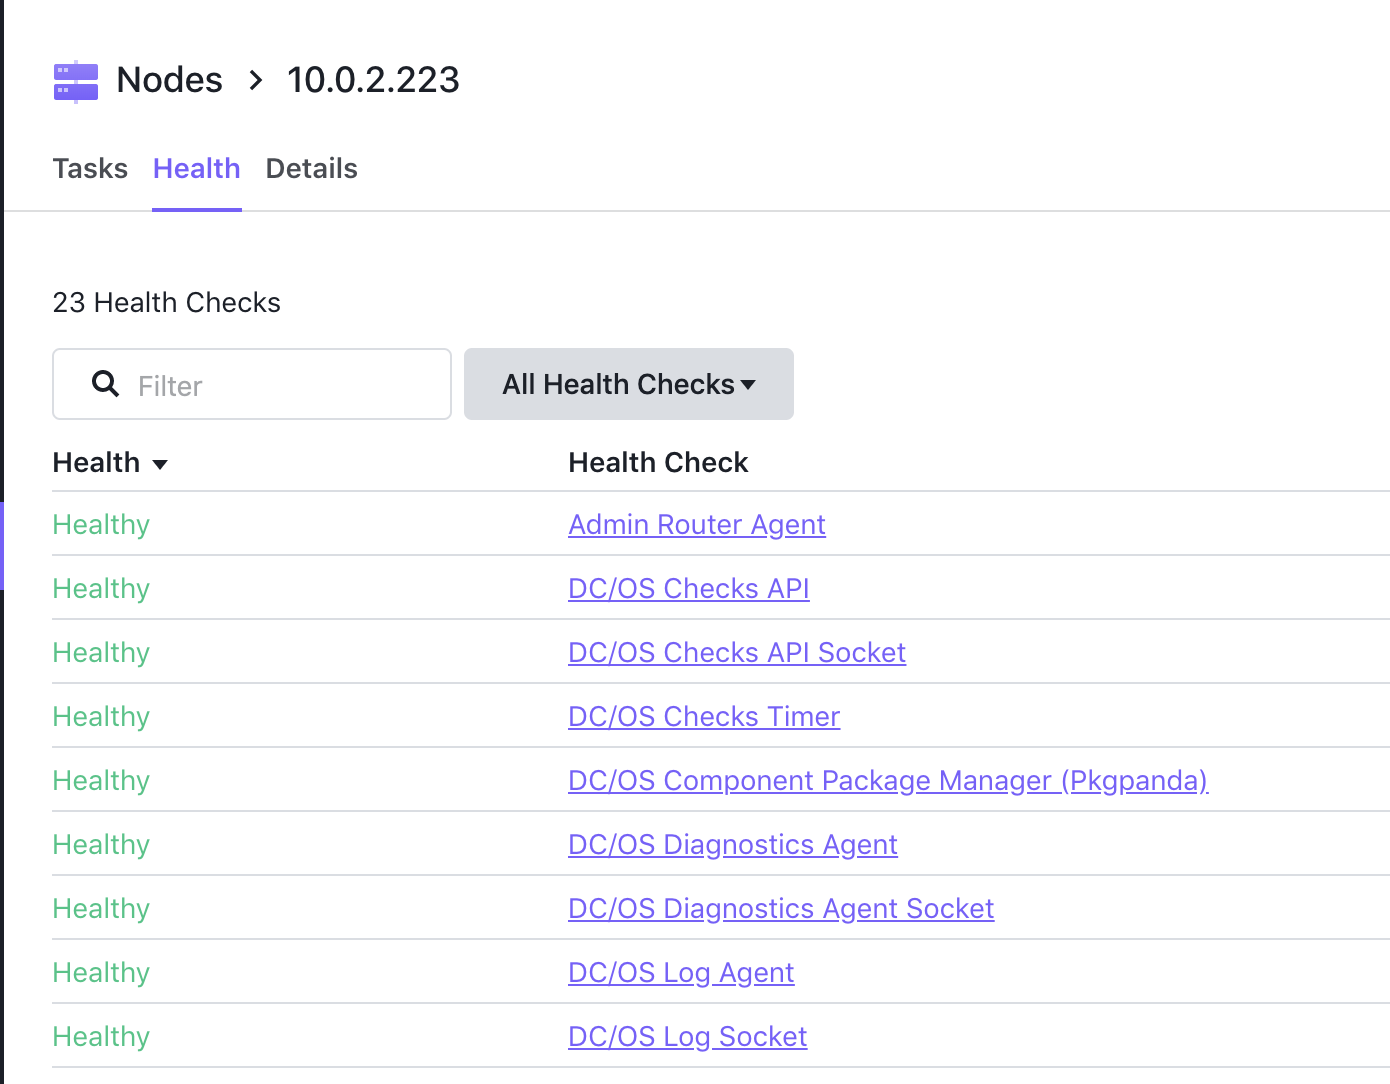
Figure 7 - Nodes > Health tab
You can filter this list using the All Health Checks drop down menu.
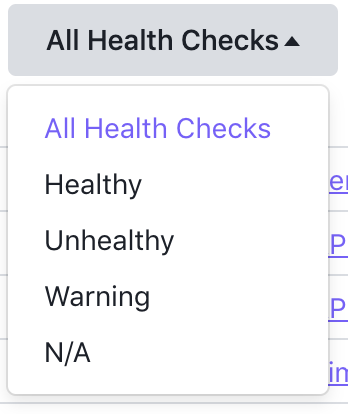
Figure 8 - Health checks filter
Details
The Nodes > Details tab will show you the identification information for this node, as well as its Status and Resources.
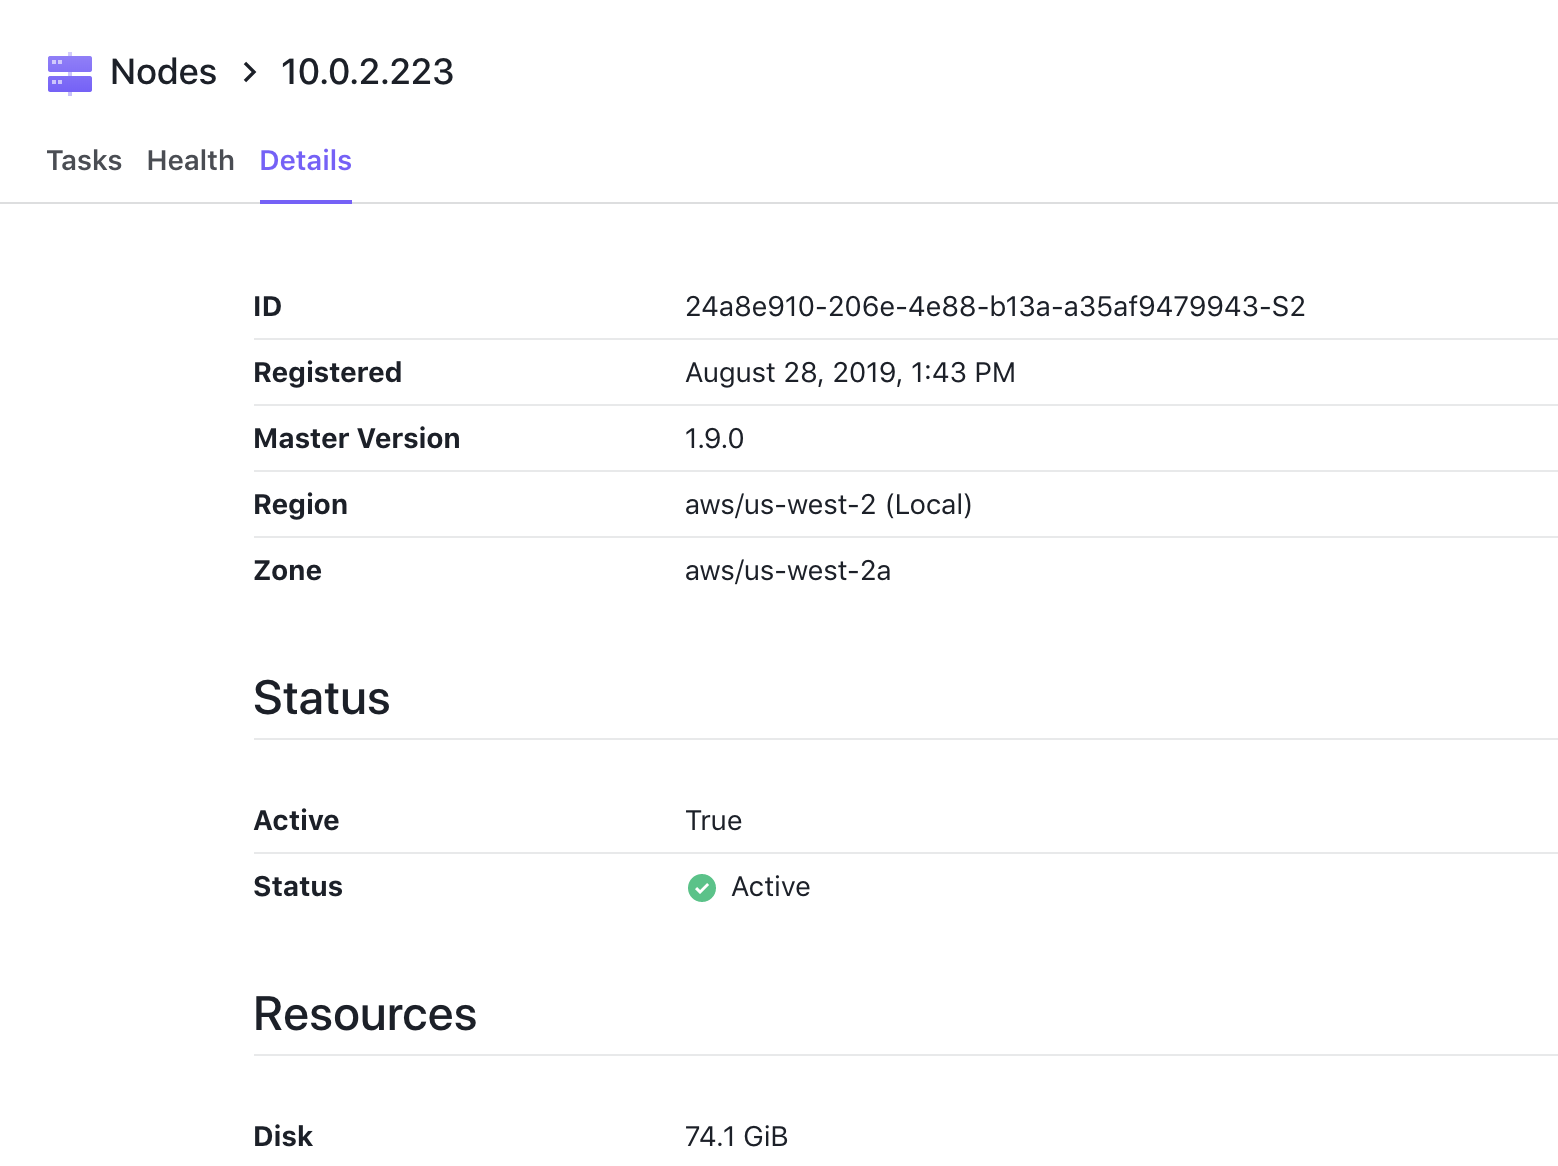
Figure 9 - Nodes details tab
Service details
If you click on the name of the service (for example, HDFS), you will see the Nodes > Service Details page. This will display information about the configuration, labels, Marathon configuration, and health check status.
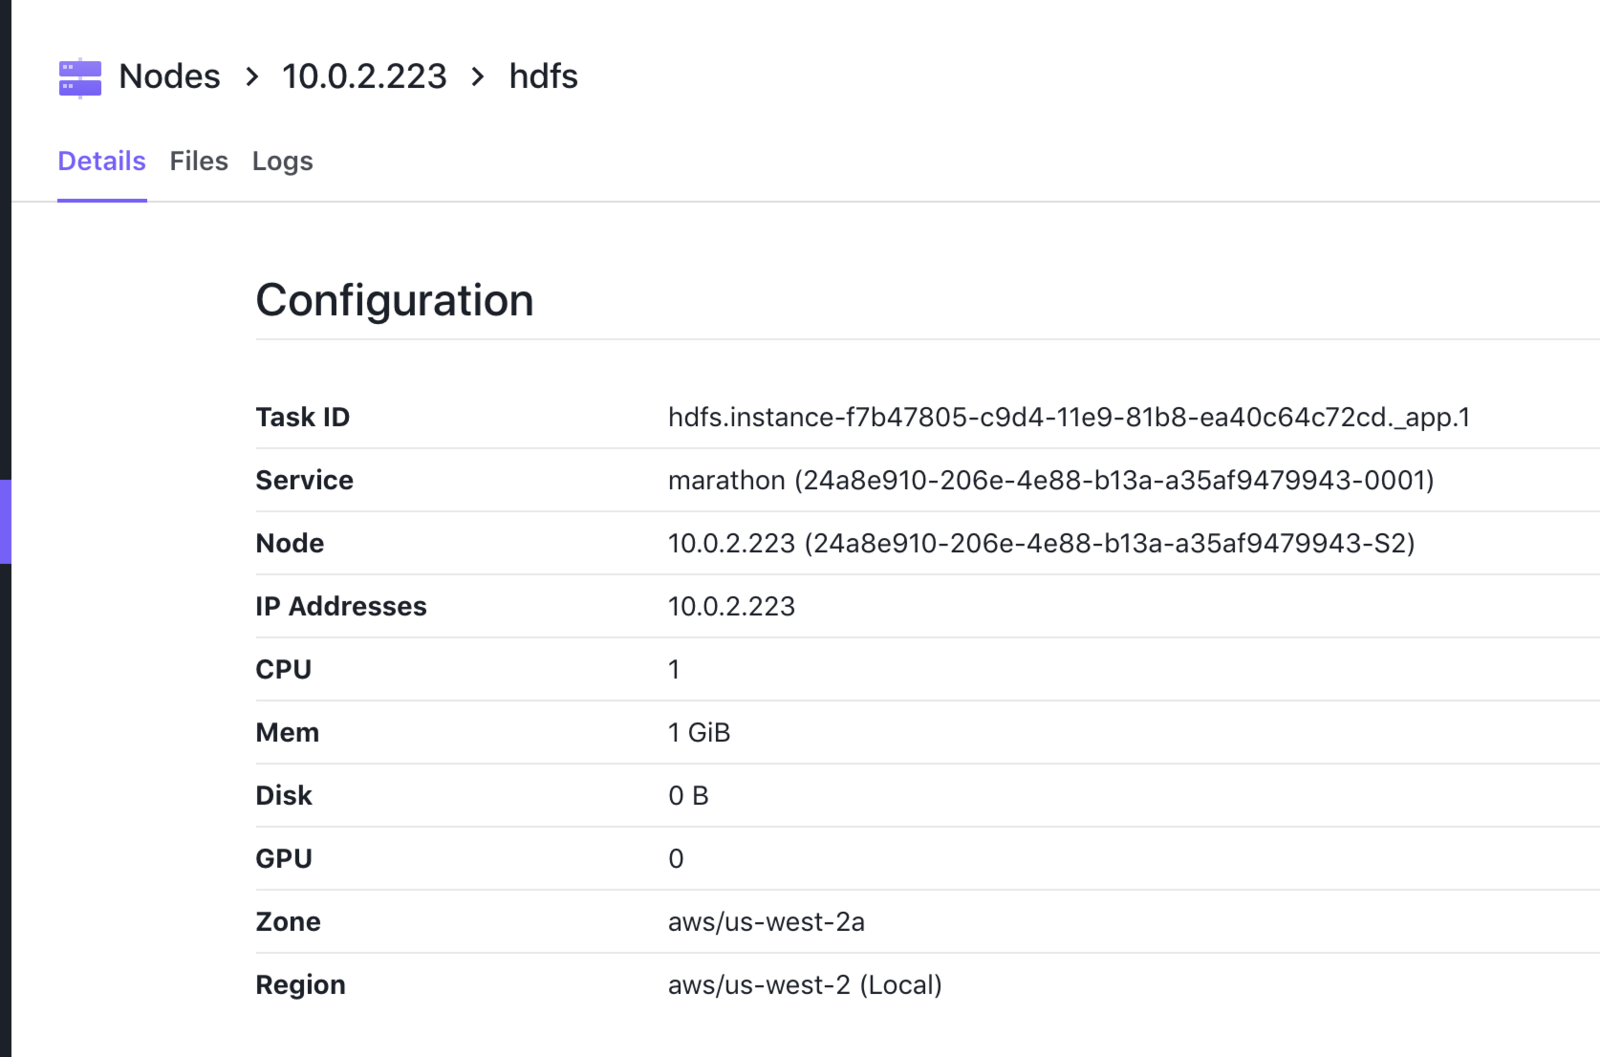
Figure 10 - Service details
Files tab
The Files tab for your service displays a Working Directory, which will display the Name, Permissions, Owner, Size and last Modification Date for this cluster.
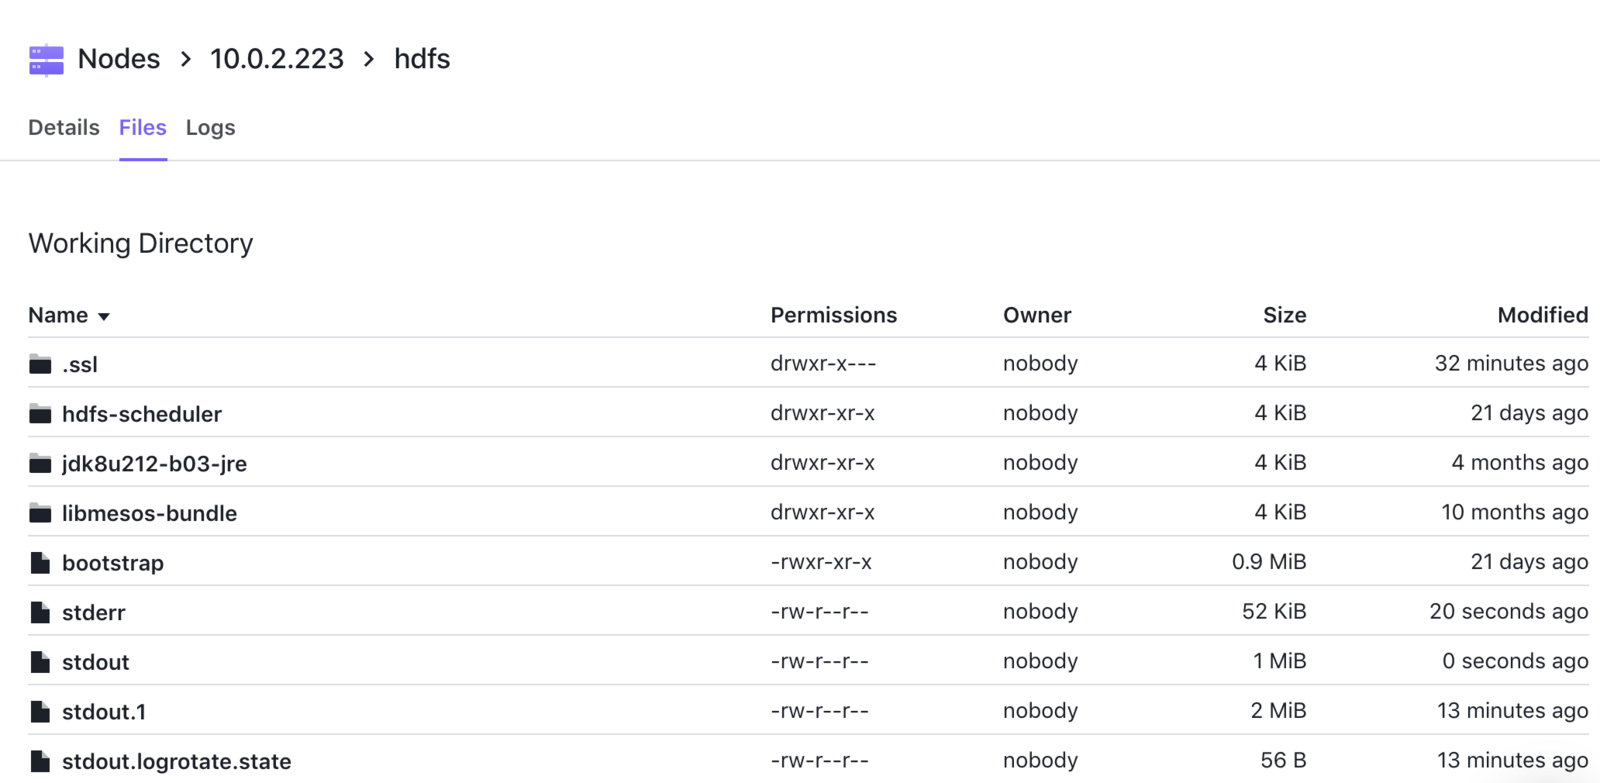
Figure 11 - Files tab
Logs tab
If you click on the Logs tab, you will see the log kept by DC/OS for your cluster.
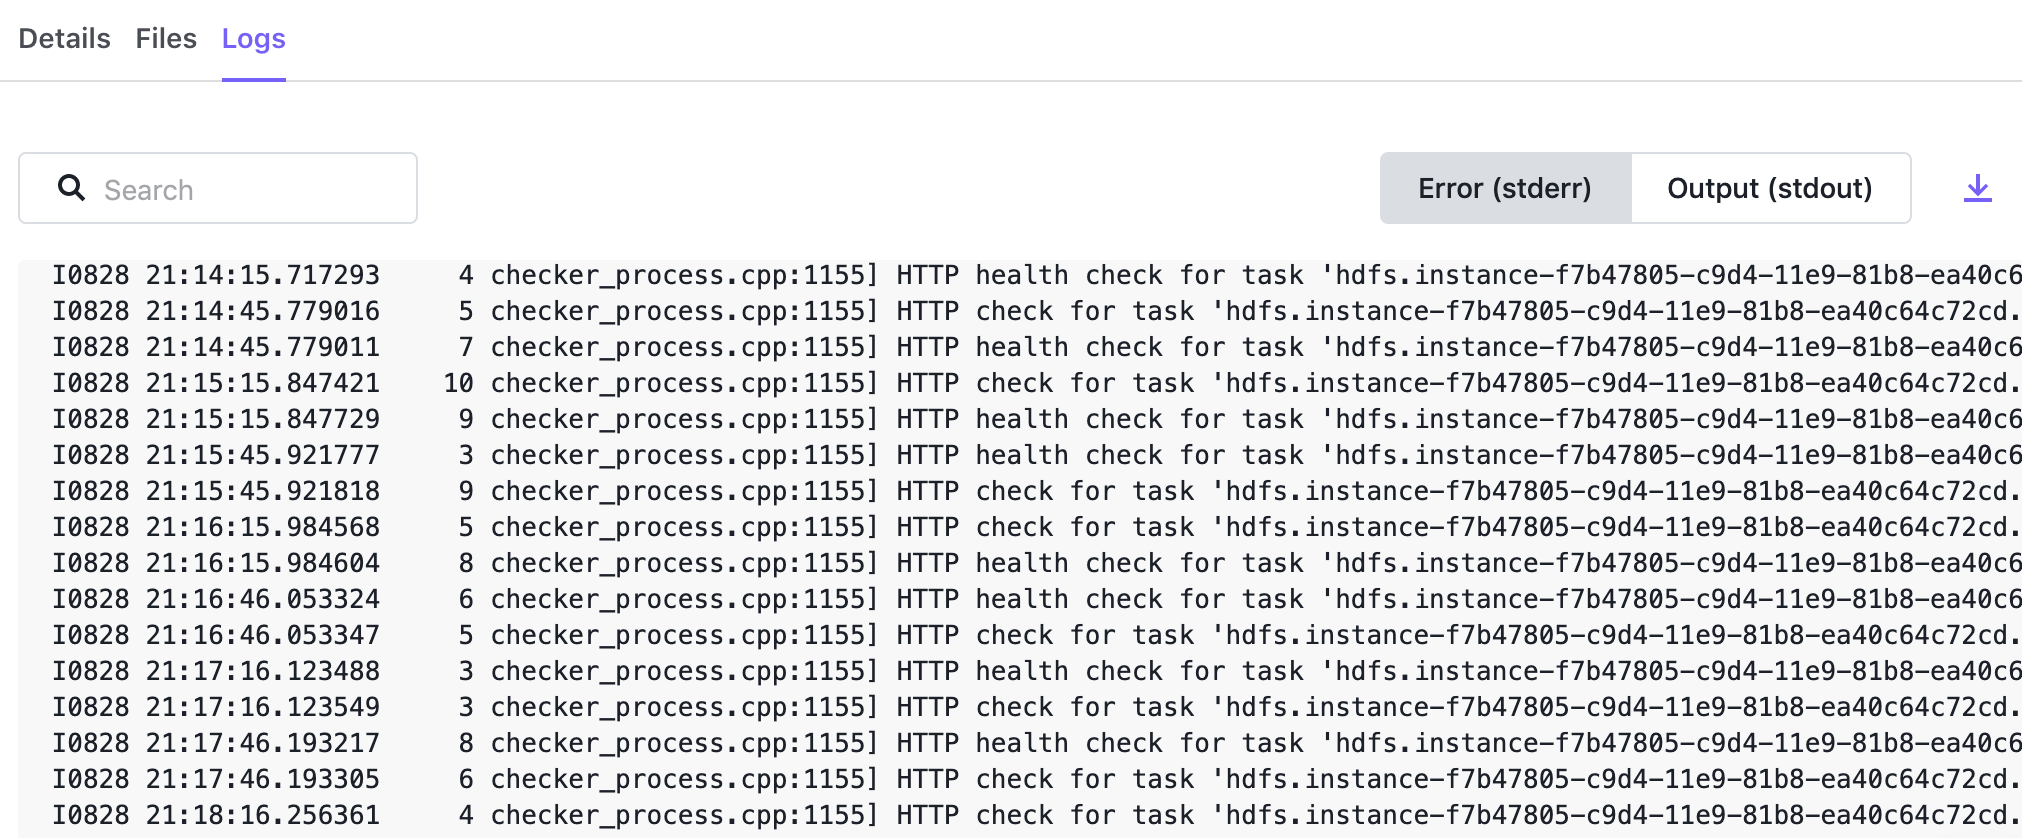
Figure 12 - Logs
You can filter the results by stderr and stdout filters. To download a copy of the log, click on the down arrow on the right hand side of the menu.
For complete details on logging, see the Logging documentation. You can also find the command line interface commands for logging in the CLI Command Reference documentation.
Host details
If you click on the IP address of the host, you will see the Tasks view by default.
Figure 13 - Node tasks
CLI equivalent commands
For information about the command line interface commands for Nodes, see the CLI Command Reference documentation.