
 DC/OS Documentation
The Nodes page provides a comprehensive view of all of the nodes that are used across your cluster. You can view a graph that shows the allocation percentage rate for CPU, memory, or disk.
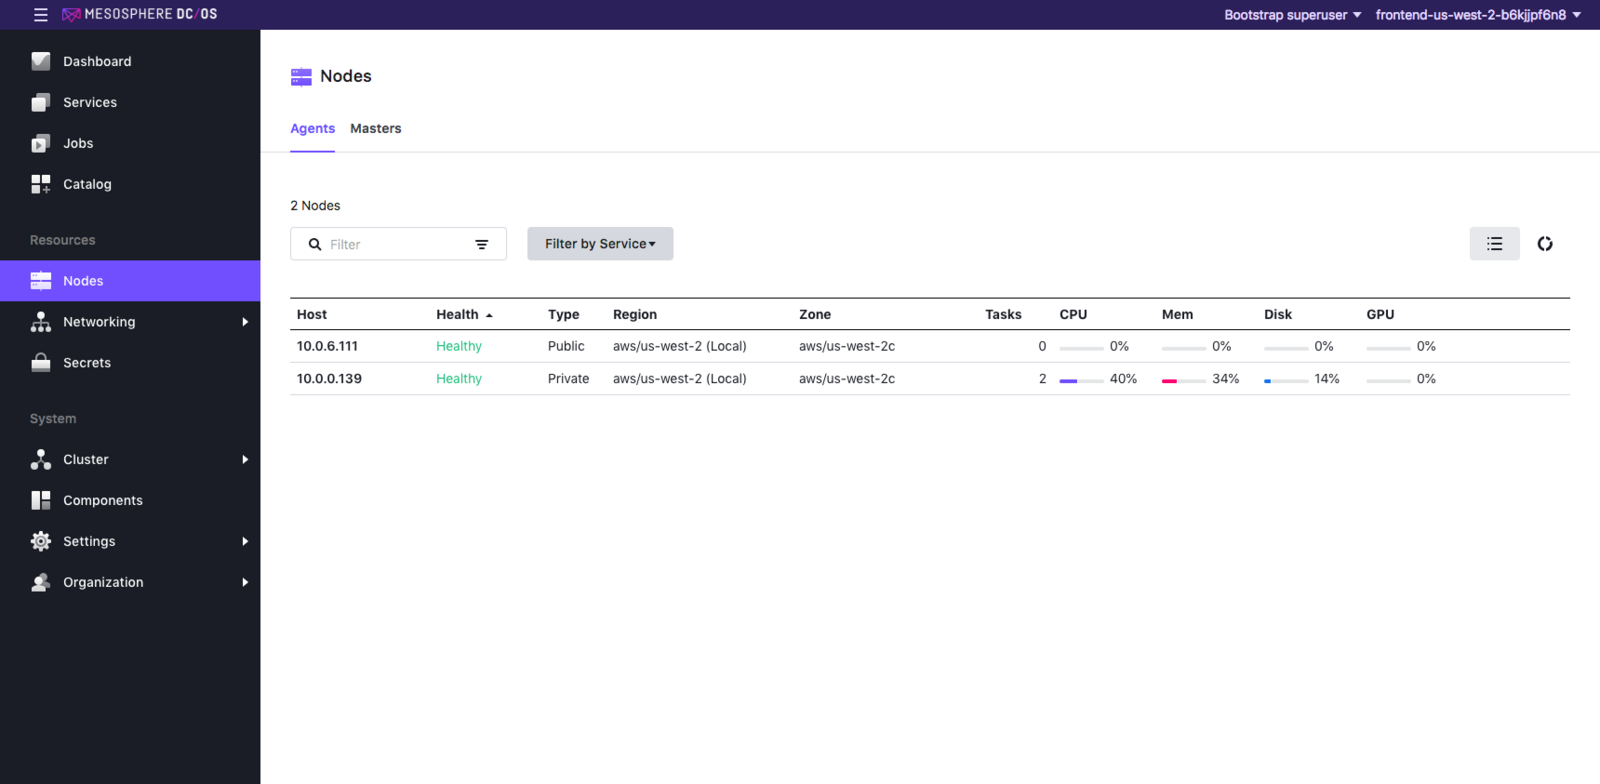
Figure 1 - Agent Nodes tab
By default, all of your nodes are displayed in List view, sorted by health. You can filter nodes by service type, health, regions, and zones. You can also sort the nodes by number of tasks or percentage of CPU, GPU, memory, or disk space allocated.
You can switch to Grid view to see a “donuts” percentage visualization.
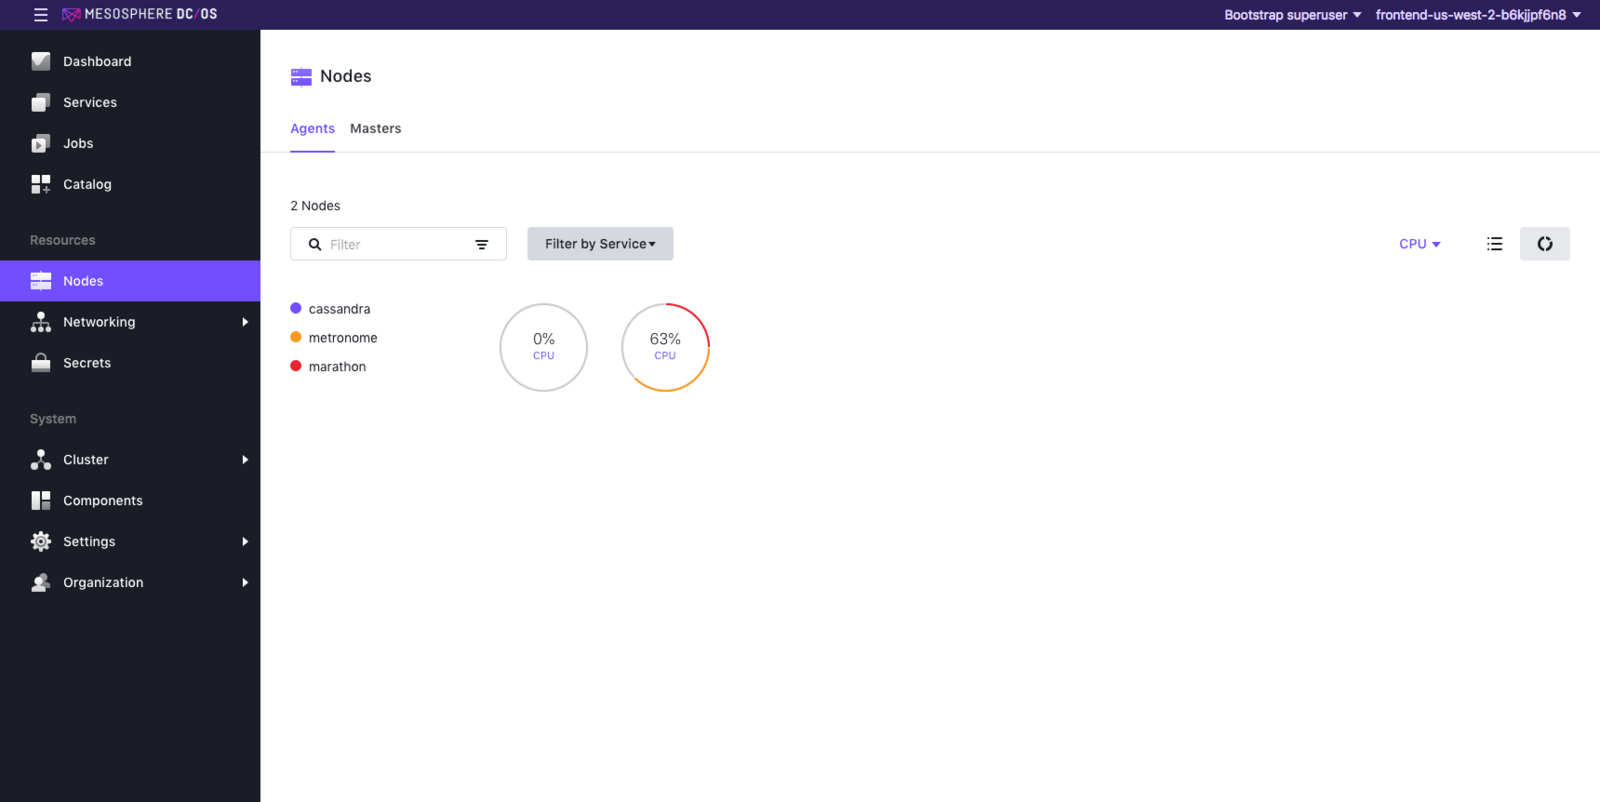
Figure 2 - Nodes grid view
Clicking on a node opens the Nodes side panel, which provides CPU, GPU, memory, and disk usage graphs and lists all tasks on the node. Use the dropdown or a custom filter to sort tasks and click on details for more information. Click on a task listed on the Nodes side panel to see detailed information about the task’s CPU, GPU, memory, and disk usage and the task’s files and directory tree.
Clicking on the Masters tab opens the Masters Nodes view.
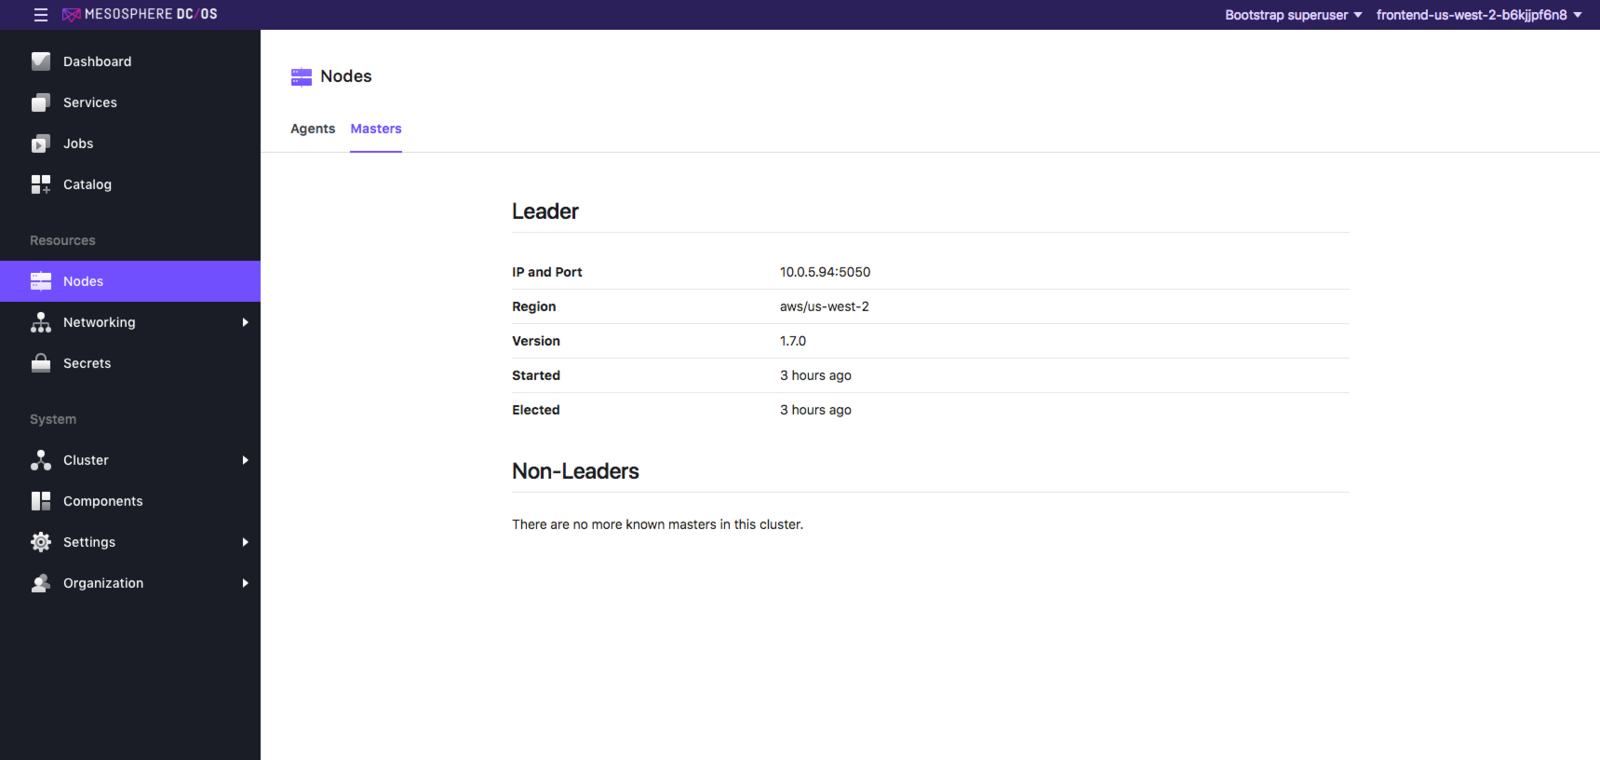
Figure 3 - Masters Nodes tab
The Masters Nodes tab shows information about the masters in the cluster. You can see the leader and non-leaders in the cluster, with their corresponding IP and port, region, version, started time, and elected time.