
 DC/OS Documentation
The Dashboard is the home page of the DC/OS™ UI. Like a snapshot, it provides a high-level overview of your DC/OS cluster.
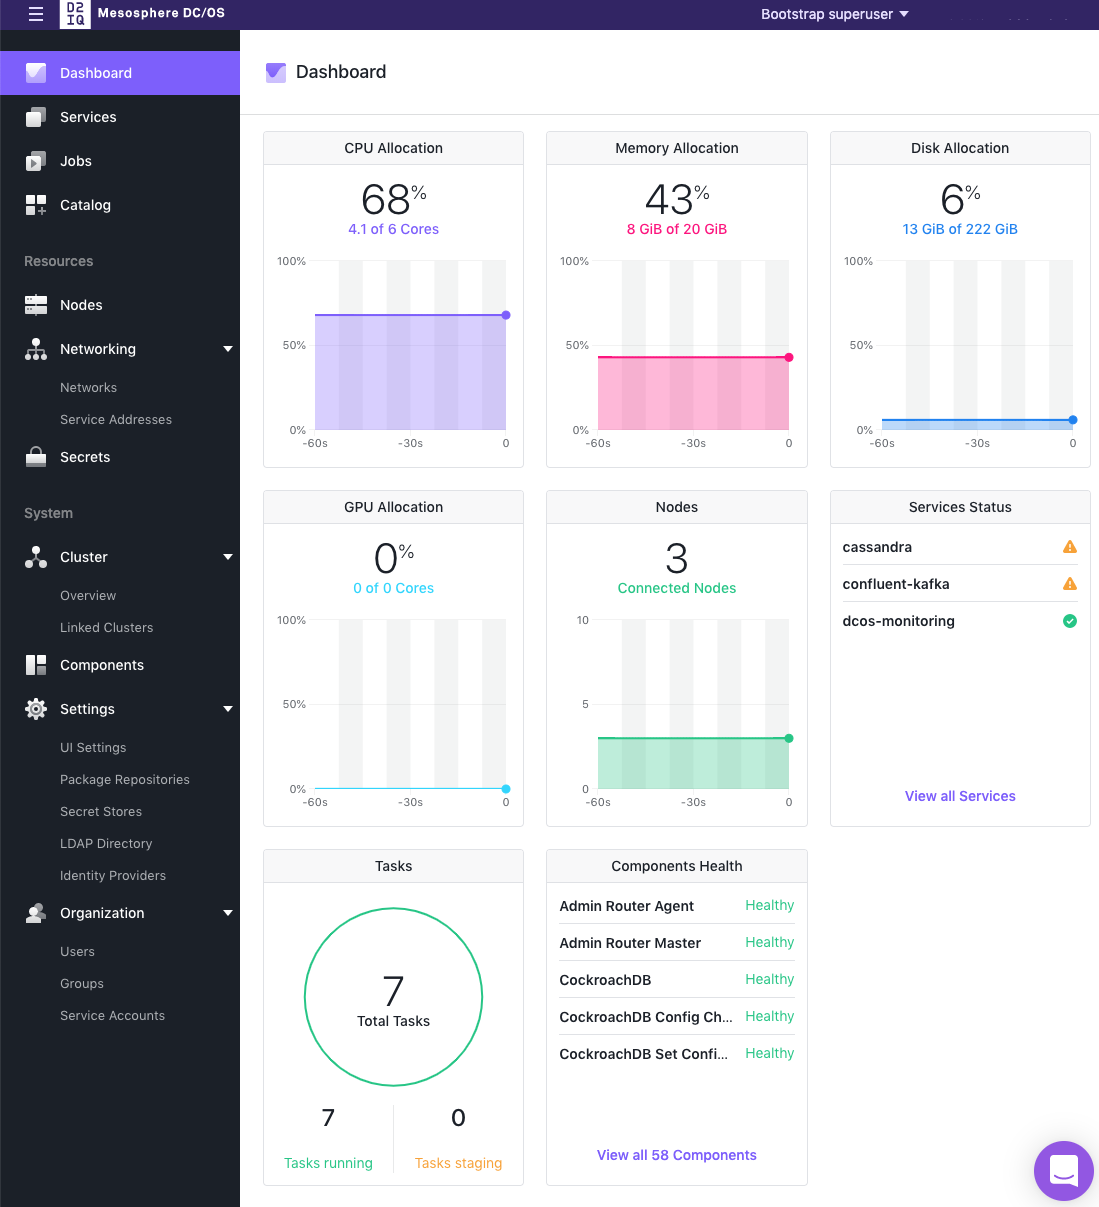
Figure 1 - Dashboard
From the Dashboard you can easily monitor the health of your cluster. The following panels may not exactly match the order in which yours are displayed on your Dashboard.
On some of the displayed tiles, such as CPU Allocation, you can move your cursor over the graph to get more details about a specific time.
| Name | Description |
|---|---|
| CPU Allocation | Displays a graph of the current percentage of available general compute units that are being used by your cluster. |
| Memory Allocation | Displays a graph of the current percentage of available memory that is being used by your cluster. |
| Disk Allocation | Displays a graph of the current percentage of available disk space that is being used by your cluster. |
| GPU Allocation | Displays a graph of the percentage of cores dedicated to GPU displays. |
| Nodes | Displays the number of connected nodes. |
| Services Status | Displays an overview of the health of your services. Each service displays a health check, run at intervals. This indicator shows the current status according to that health check. A maximum of 5 services are displayed, sorted by priority of the most unhealthy. You can click the View All Services button for detailed information and a complete list of your services. If you click on the name of a service under the Services Status box, the Services details page for that service will open. See the Services UI documentation for details. |
| Tasks | Displays the current number of tasks that are staged and running. |
| Components Health | Displays an overview of the health of each component. Each component provides a health check, run at intervals. This indicator shows the current status according to that health check. A maximum of 5 components are displayed, sorted by priority of the most unhealthy. You can click the View All <number> Components button for detailed information and a complete list of your components. If you click on the name of a Components under the Component Status box, the Components details page for that service will open. See the Components UI documentation for details. |
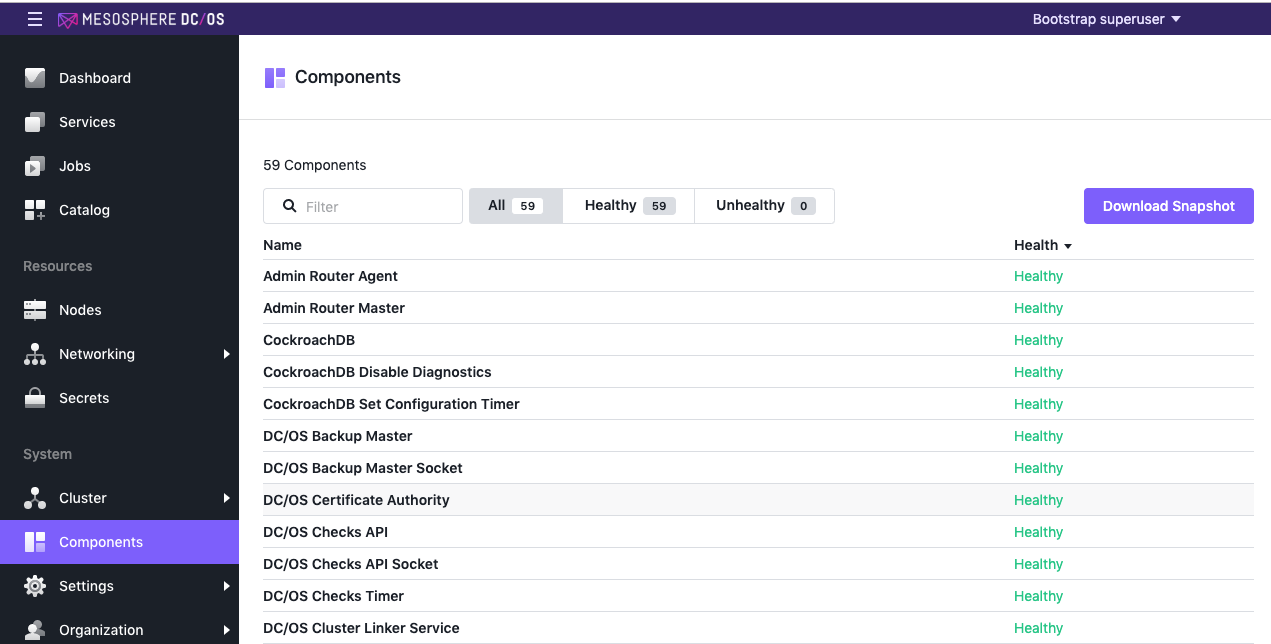
Figure 2 - List of Components, showing Health status