
 DC/OS Documentation
The dashboard is the home page of the DC/OS UI. It provides a high-level overview of your DC/OS cluster.
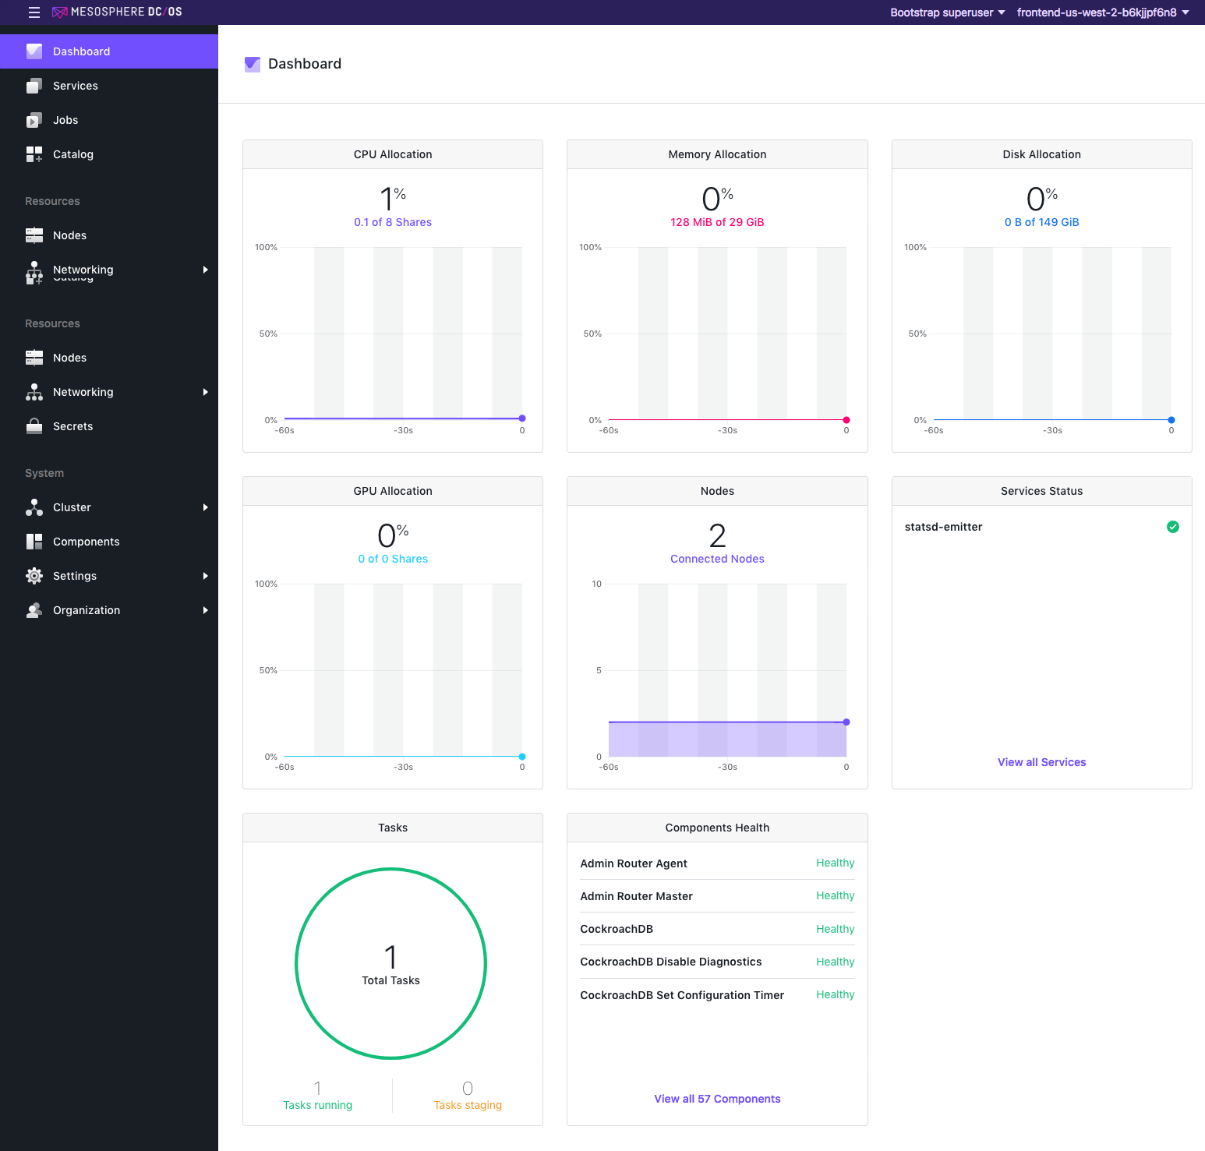
Figure 1 - Dashboard
From the dashboard you can easily monitor the health of your cluster.
-
The CPU Allocation panel displays a graph of the current percentage of available general compute units that are being used by your cluster.
-
The Memory Allocation panel displays a graph of the current percentage of available memory that is being used by your cluster.
-
The Disk Allocation panel displays a graph of the current percentage of available disk space that is being used by your cluster.
-
The Services Health panel displays an overview of the health of your services. Each service displays a health check, run at intervals. This indicator shows the current status according to that health check. A maximum of 5 services are displayed, sorted by priority of the most unhealthy. You can click the View All
<number>Services button for detailed information and a complete list of your services. -
The Tasks panel displays the current number of tasks that are staged and running.
-
The Component Health panel displays an overview of the health of your component. Each component provides a health check, run at intervals. This indicator shows the current status according to that health check. A maximum of 5 components are displayed, sorted by priority of the most unhealthy. You can click the View All
<number>Components button for detailed information and a complete list of your components. -
The Nodes panel displays an overview of the nodes in your cluster.