Pxc Documentation
Percona XtraDB Cluster uses Prometheus and Grafana to show information about your system’s performance. Use these services to diagnose issues on your Percona XtraDB Cluster service.
How to see Metrics with Prometheus and Grafana with DC/OS
Prerequisites
- A cluster running DC/OS 1.11 or later
Install Prometheus and Grafana
Prometheus can be installed via either the DC/OS Catalog GUI or by using the CLI. The following command will launch the install via the DC/OS CLI:
dcos package install prometheus
Install Grafana from the service catalog as well. It can be used as a graphing tool.
dcos package install --yes grafana
The framework provides options to enter the Prometheus, AlertManager and Rules config. The default Prometheus configuration scrapes a DC/OS master and agents in the clusters. Append any new config to the end.
Accessing the Prometheus GUI
Once the framework is up and running:
- Install Edge-LB.
- Create a file named
prometheus-edgelb.jsoncontaining the followingedge-lbconfiguration:
{
  "apiVersion": "V2",
  "name": "prometheus",
  "count": 1,
  "haproxy": {
    "frontends": [
      {
        "bindPort": 9092,
        "protocol": "HTTP",
        "linkBackend": {
          "defaultBackend": "prometheus"
        }
      },
      {
        "bindPort": 9093,
        "protocol": "HTTP",
        "linkBackend": {
          "defaultBackend": "alertmanager"
        }
      },
      {
        "bindPort": 9094,
        "protocol": "HTTP",
        "linkBackend": {
          "defaultBackend": "grafana"
        }
      },
      {
        "bindPort": 9091,
        "protocol": "HTTP",
        "linkBackend": {
          "defaultBackend": "pushgateway"
        }
      }
    ],
    "backends": [
     {
      "name": "prometheus",
      "protocol": "HTTP",
      "services": [{
        "endpoint": {
          "type": "ADDRESS",
          "address": "prometheus.prometheus.l4lb.thisdcos.directory",
          "port": 9090
        }
      }]
    },
    {
     "name": "alertmanager",
     "protocol": "HTTP",
     "services": [{
       "endpoint": {
         "type": "ADDRESS",
         "address": "alertmanager.prometheus.l4lb.thisdcos.directory",
         "port": 9093
       }
     }]
   },
   {
    "name": "grafana",
    "protocol": "HTTP",
    "services": [{
      "endpoint": {
        "type": "ADDRESS",
        "address": "grafana.grafana.l4lb.thisdcos.directory",
        "port": 3000
      }
    }]
   },
   {
    "name": "pushgateway",
    "protocol": "HTTP",
    "services": [{
      "endpoint": {
        "type": "ADDRESS",
        "address": "pushgateway.prometheus.l4lb.thisdcos.directory",
        "port": 9091
      }
    }]
   }
   ]
  }
}
- In your browser enter the Prometheus URL:
http://<public-agent-ip>:9092
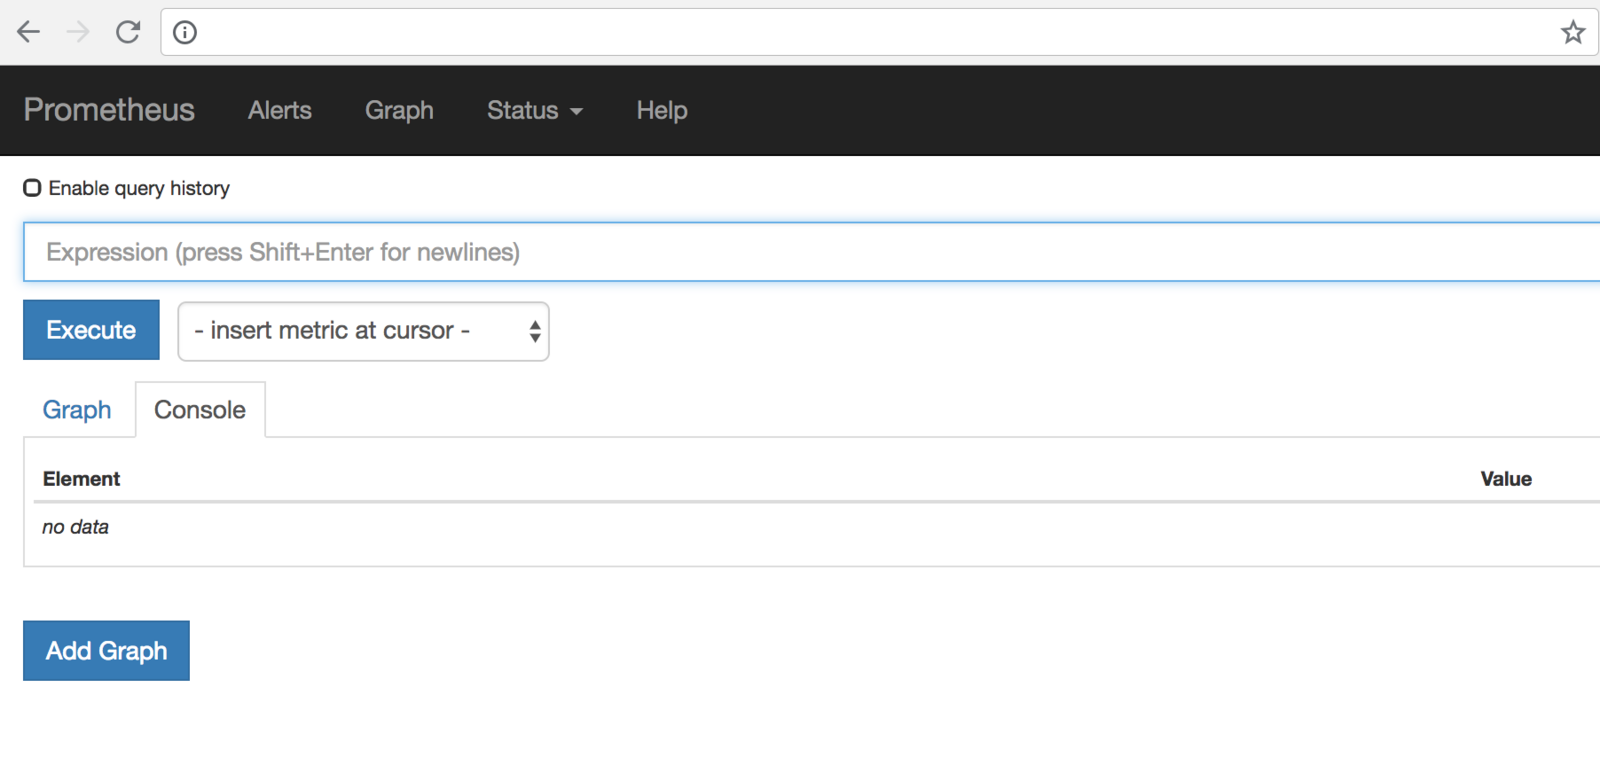
This is the console view within the Graph tab.
You can also verify that Prometheus is serving metrics about itself by navigating to its metrics endpoint:
http://<public-agent-ip>:9092/metrics
Using the Expression browser
Go back to the console view, and enter this into the expression console:
prometheus_target_interval_length_seconds
This should return a number of different time series (along with the latest value recorded for each), all with the metric name prometheus_target_interval_length_seconds.
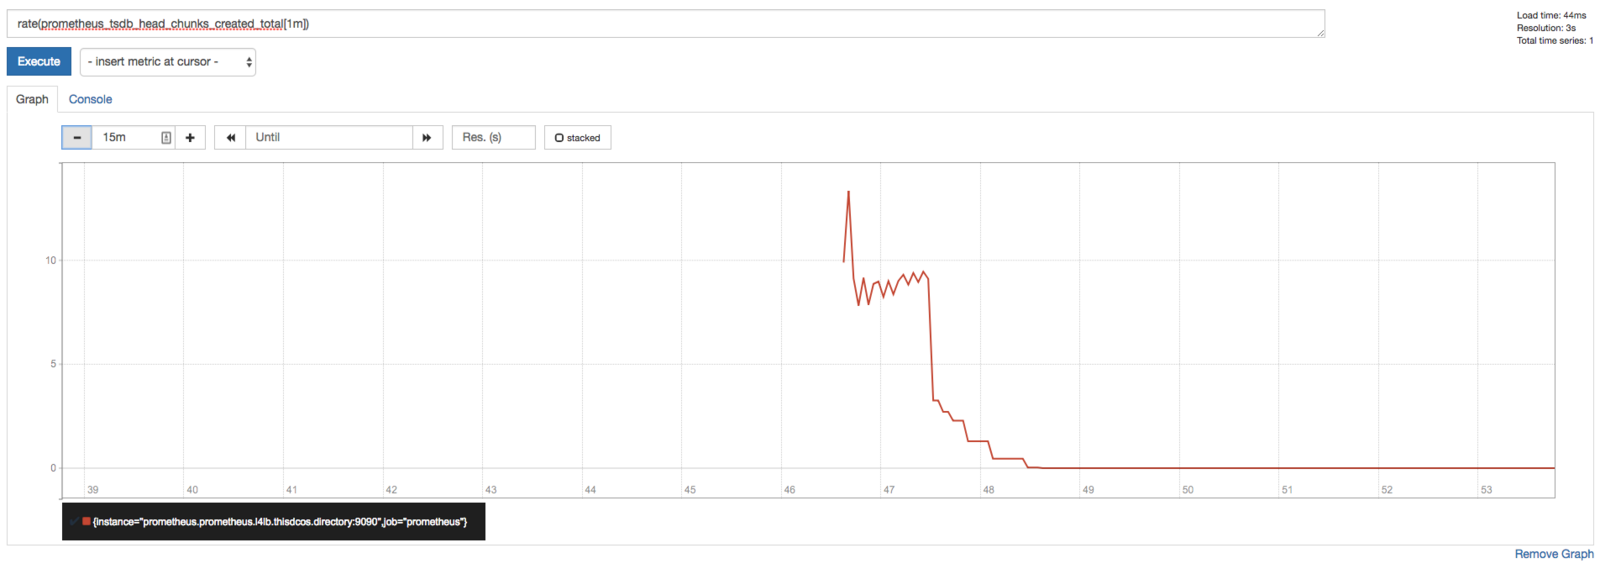
As another example, enter the following expression to graph the per-second rate of chunks being created in the self-scraped Prometheus:
rate(prometheus_tsdb_head_chunks_created_total[1m])
Using Grafana with Prometheus
http://<public-agent-ip>:9094
Credentials: admin / admin
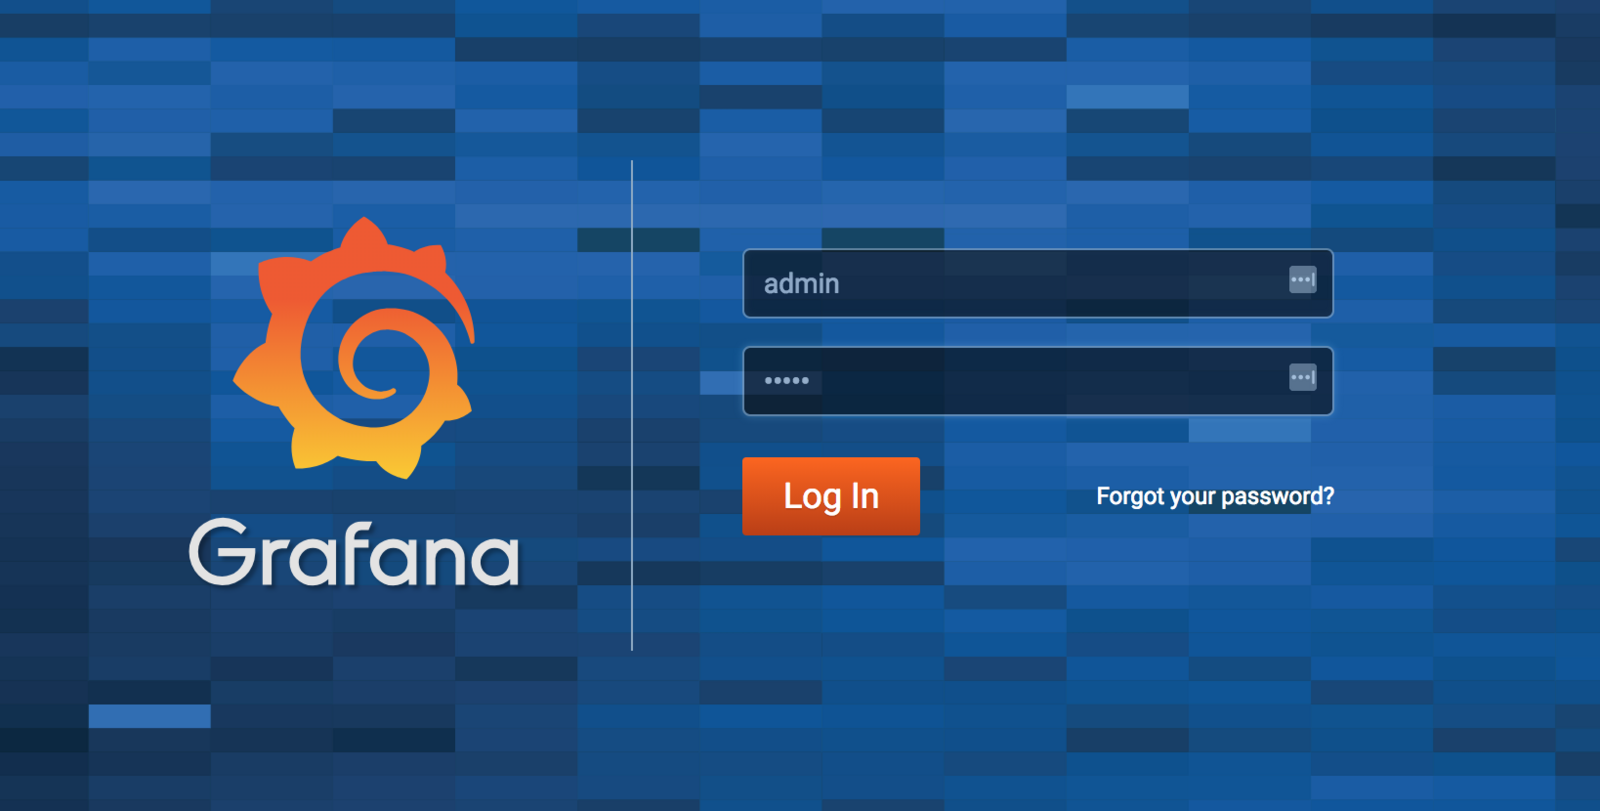
which takes you to the Grafana console.
You can add Prometheus as a data source:
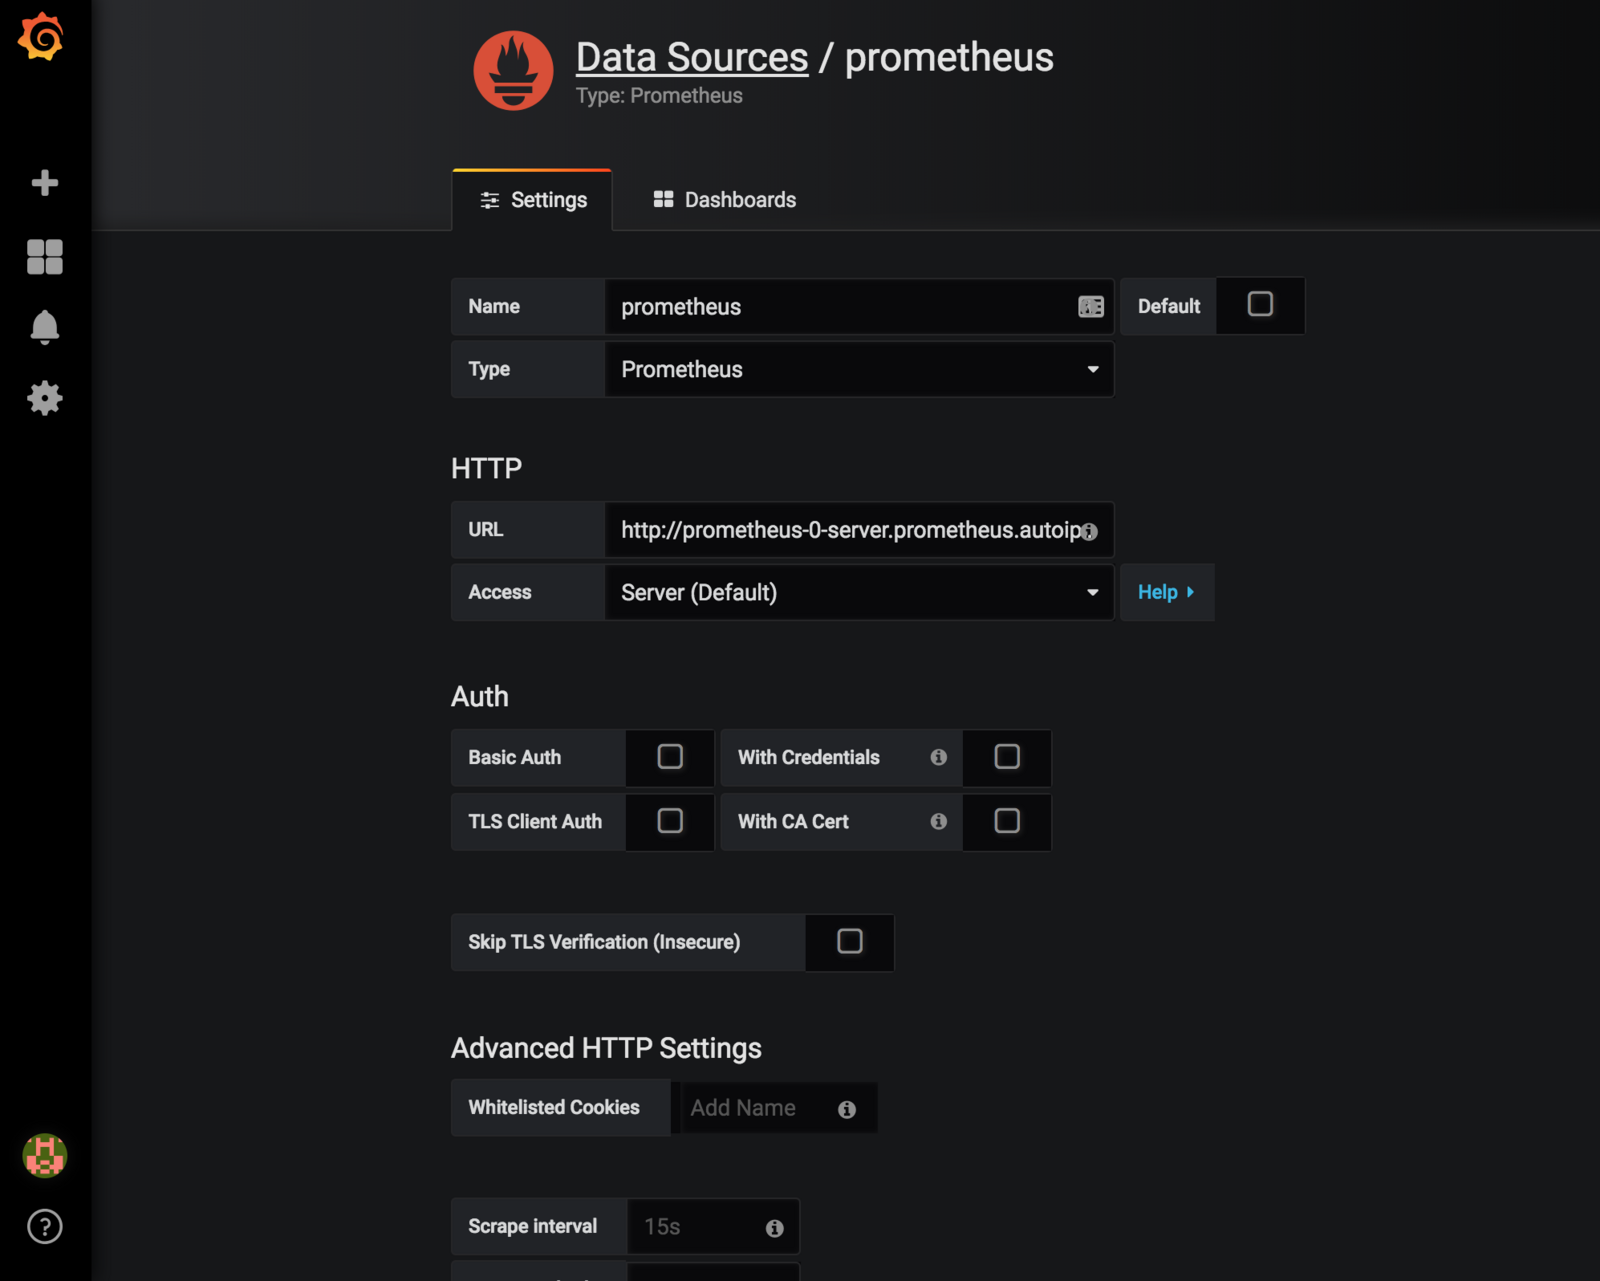
Save and Test. Now you are ready to use Prometheus as a data source in Grafana.
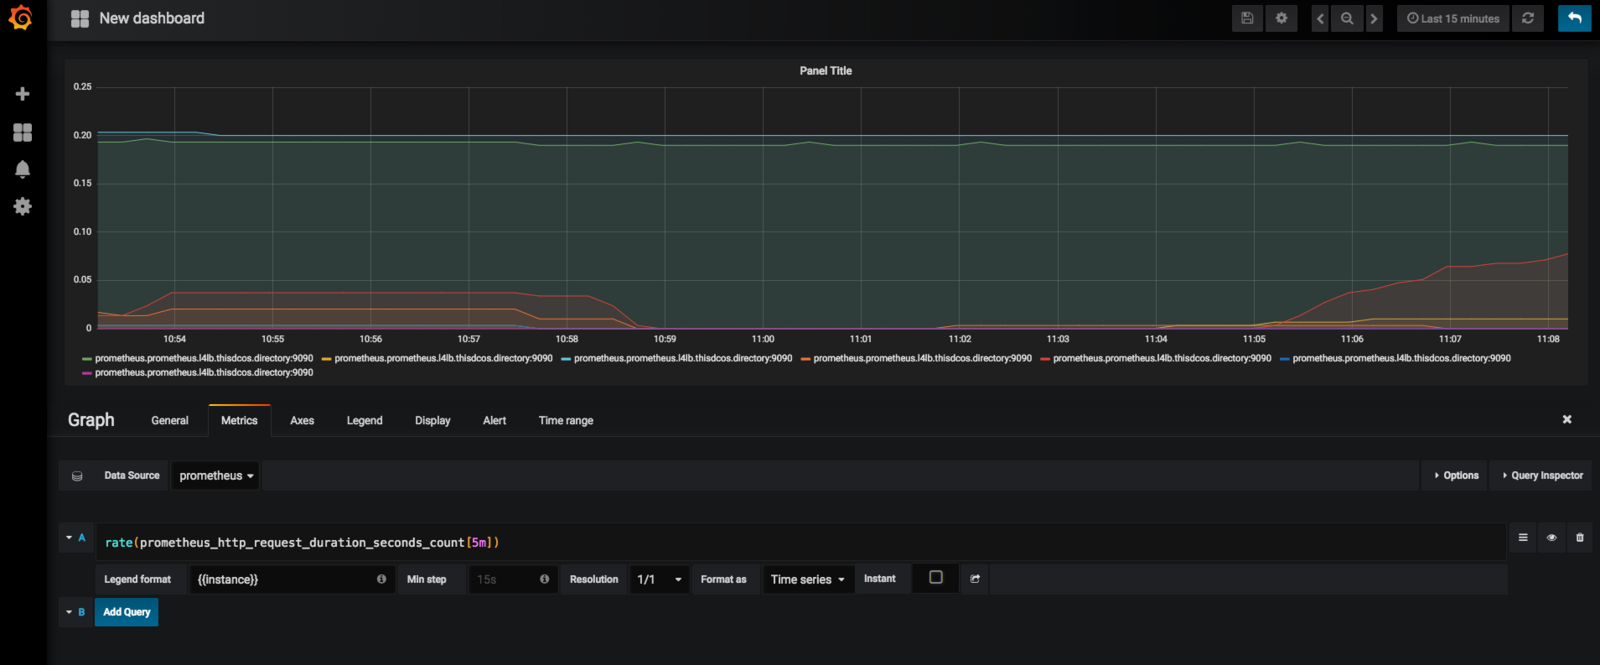
To create a graph, select your Prometheus datasource, and enter any Prometheus expression into the “Query” field, while using the “Metric” field to lookup metrics via autocompletion.
The following shows an example Prometheus graph configuration: