
 DC/OS Documentation
You can debug your service or pod from the DC/OS UI.
Service and Pod Health and Status Summaries
If you have added a Marathon health check to your service or pod, the Services Health box on the DC/OS dashboard will report the health of your service or pod.
The Services > Services page lists each service or pod, the resources it has requested, and its status. Possible statuses are Deploying, Waiting, or Running. If you have set up a Marathon health check, you can also see the health of your service or pod: a green dot for healthy and a red dot for unhealthy. If you have not set up a health check, the dot will be gray.
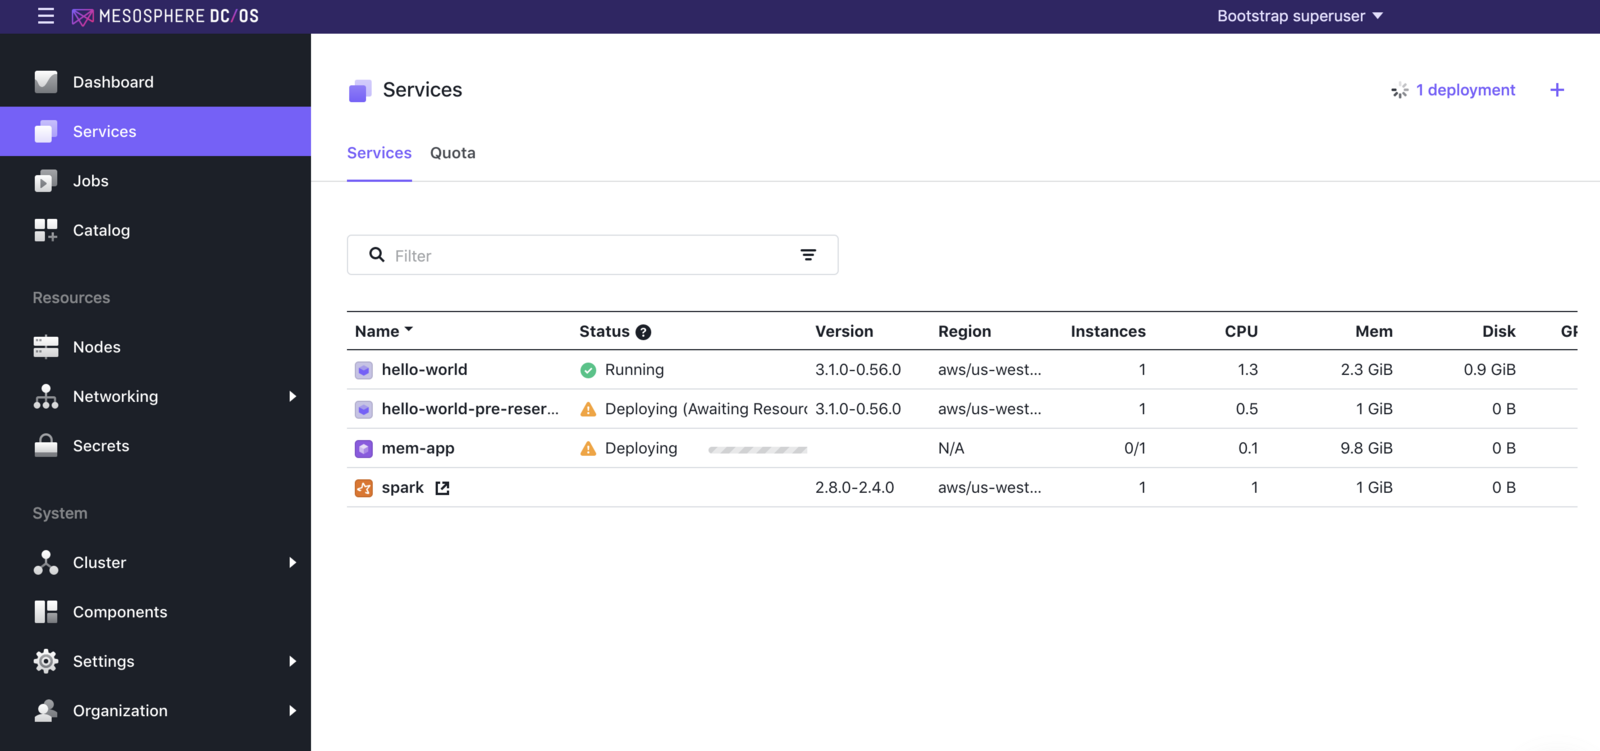
Figure 1 - DC/OS Services page
Debugging Page
To reveal a detailed debugging page, click the name of a service or pod and then the Debug tab. There, you will see sections for Last Changes, Last Task Failure, Task Statistics, Recent Resource Offers. You will also see a Summary of resource offers and what percentage of those offers matched your pod or service’s requirements, as well as a Details section that lists the host where your service or pod is running and which resource offers were successful and unsuccessful for each deployment. You can use the information on this page to learn where and how you need to modify your service or pod definition.
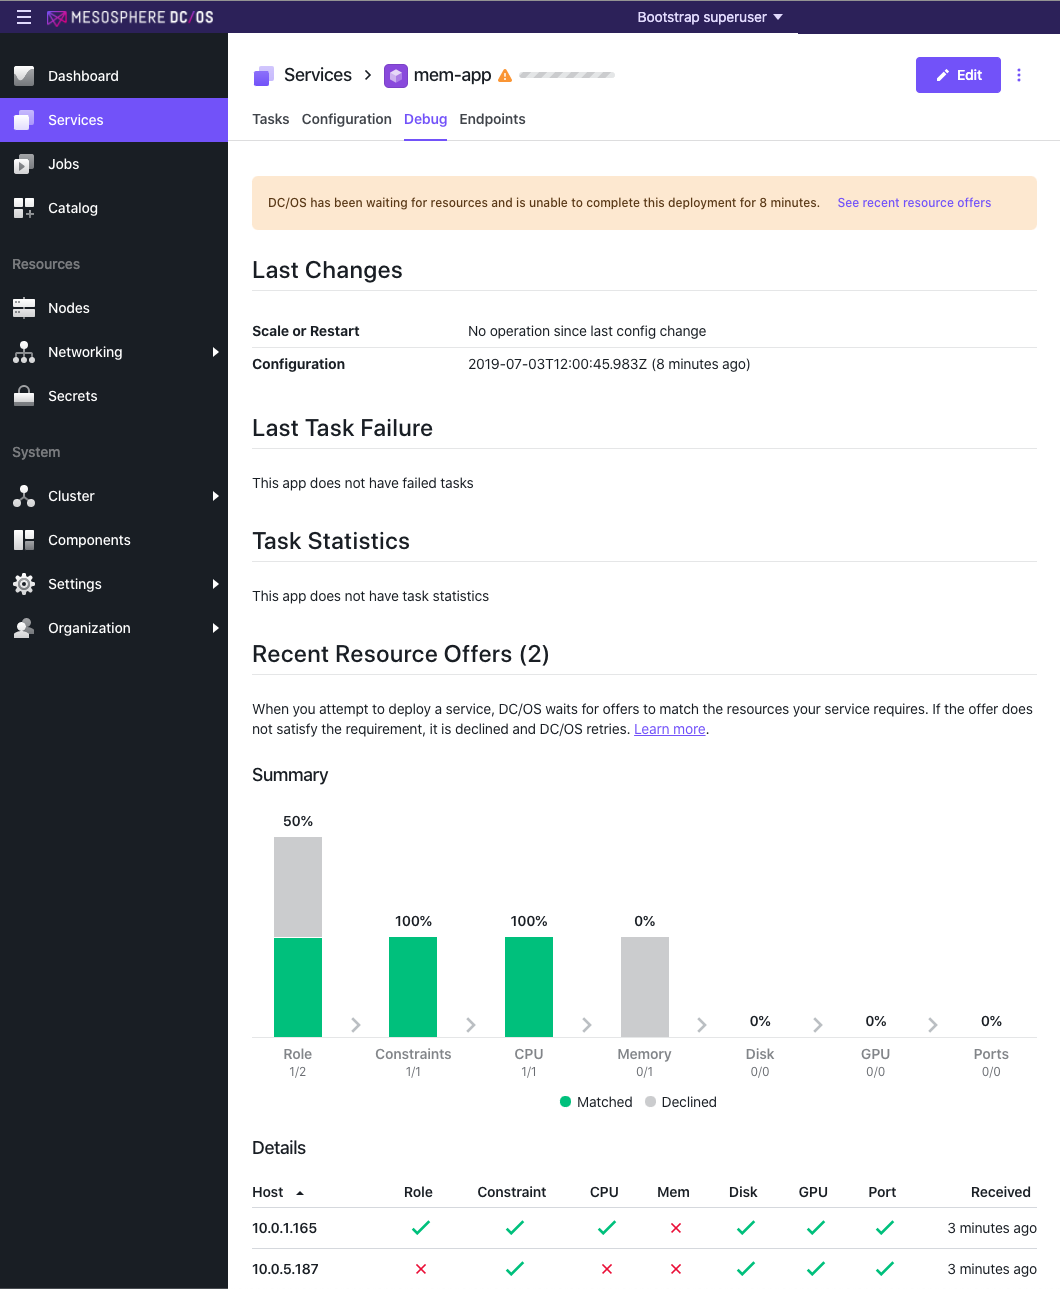
Figure 2 - Debugging page
Example
The Services > Debug tab displays the last changes, task failures, and other status messages, which can help debug issues with service deployments.
In the following figure, Marathon has failed to launch a service; DC/OS displays a warning message and then a message stating that the error has cleared and that the service is now launching.
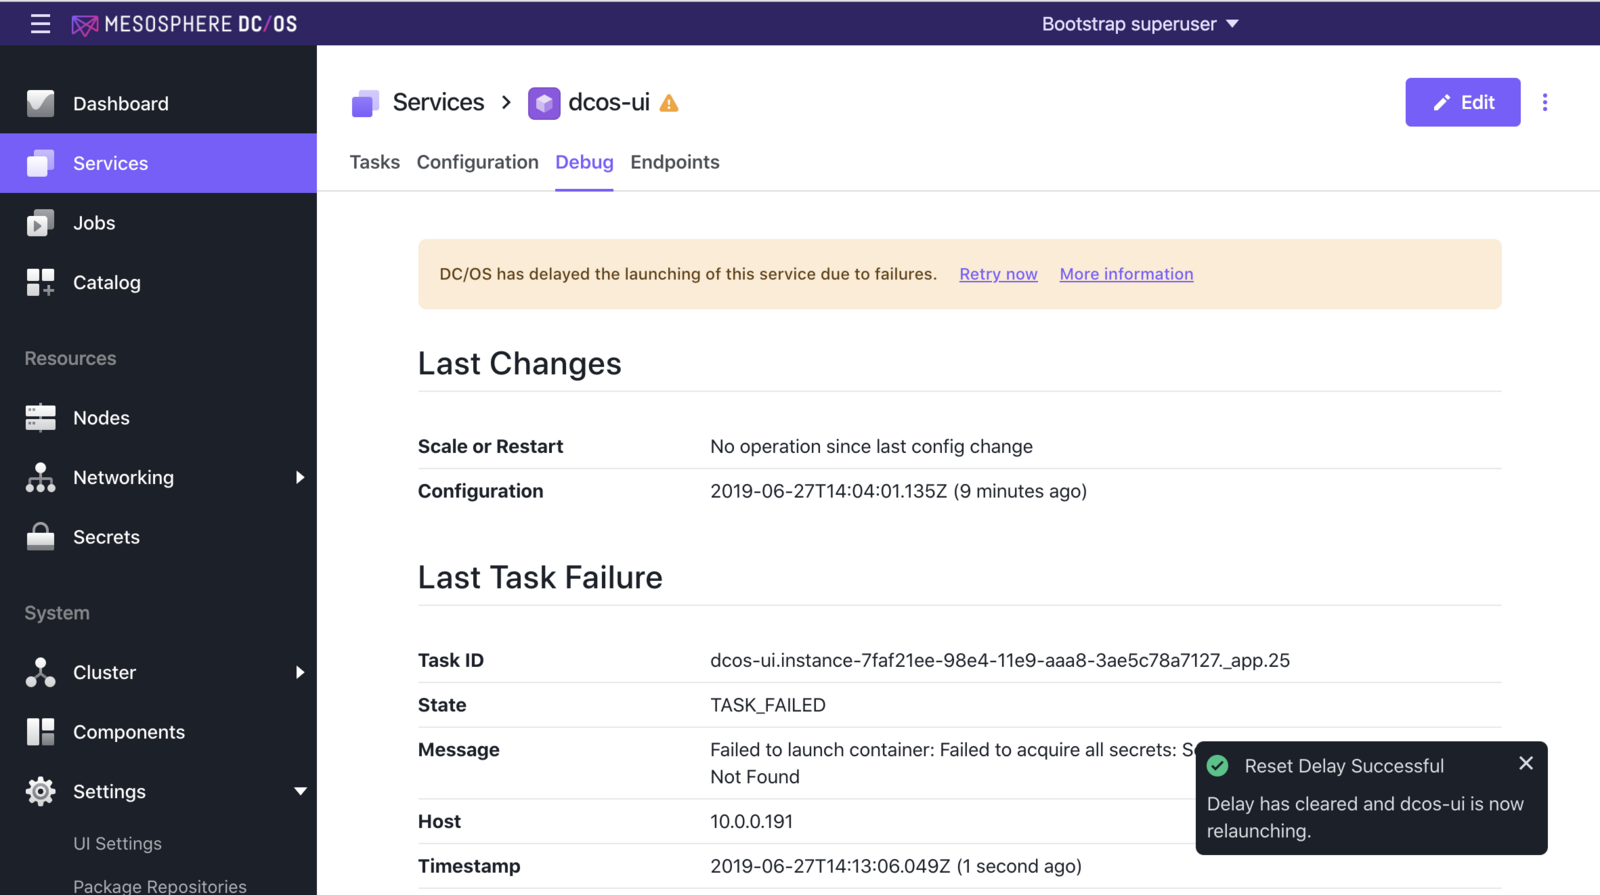
Figure 3 - Debug tab showing warning