
 Kommander Documentation
You can only view the log data for a Project to which you have been granted access.
Run the following commands on the management cluster:
-
Execute the following command to get the namespace of your workspace
kubectl get workspacesCopy the value under
WORKSPACE NAMESPACEcolumn for your workspace. This may NOT be identical to the Display Name of theWorkspace. -
Export the
WORKSPACE_NAMESPACEvariable:export WORKSPACE_NAMESPACE=<WORKSPACE_NAMESPACE> -
Execute the following command to get the namespace of your project
kubectl get projects -n ${WORKSPACE_NAMESPACE}Copy the value under
PROJECT NAMESPACEcolumn for your project. This may NOT be identical to the Display Name of theProject. -
Export the
PROJECT_NAMESPACEvariable:export PROJECT_NAMESPACE=<PROJECT_NAMESPACE>Run the following commands on the attached cluster to access the Project’s Grafana UI:
Ensure you switched to the correct context or kubeconfig of the attached cluster for the following kubectl commands:
-
Get the Grafana URL:
kubectl get ingress -n ${PROJECT_NAMESPACE} ${PROJECT_NAMESPACE}-project-grafana-logging -o go-template='https://{{with index .status.loadBalancer.ingress 0}}{{or .hostname .ip}}{{end}}{{with index .spec.rules 0}}{{with index .http.paths 0}}{{.path }}{{end}}{{end}}{{"\n"}}'
To view logs in Grafana:
-
Go to the
Exploretab:kubectl get ingress -n ${PROJECT_NAMESPACE} ${PROJECT_NAMESPACE}-project-grafana-logging -o go-template='https://{{with index .status.loadBalancer.ingress 0}}{{or .hostname .ip}}{{end}}{{with index .spec.rules 0}}{{with index .http.paths 0}}{{.path }}{{end}}{{end}}/explore{{"\n"}}' -
You may be prompted to log in using the SSO flow. See Kommander Security for more information.
-
At the top of the page, change the datasource to
Loki.
See the Grafana Loki documentation for more on how to use the interface to view and query logs.
You can configure workspace policy to restrict access to the Project logging Grafana UI.
Each Grafana instance in a Project has a unique URL at the cluster level. Consider creating a WorkspaceRoleBinding that maps to a ClusterRoleBinding, on attached cluster(s), for each Project level Grafana instance. For example, If you have a group named sample-group and two projects named first-project and second-project in sample-workspace workspace, then the Role Bindings look similar to the following:
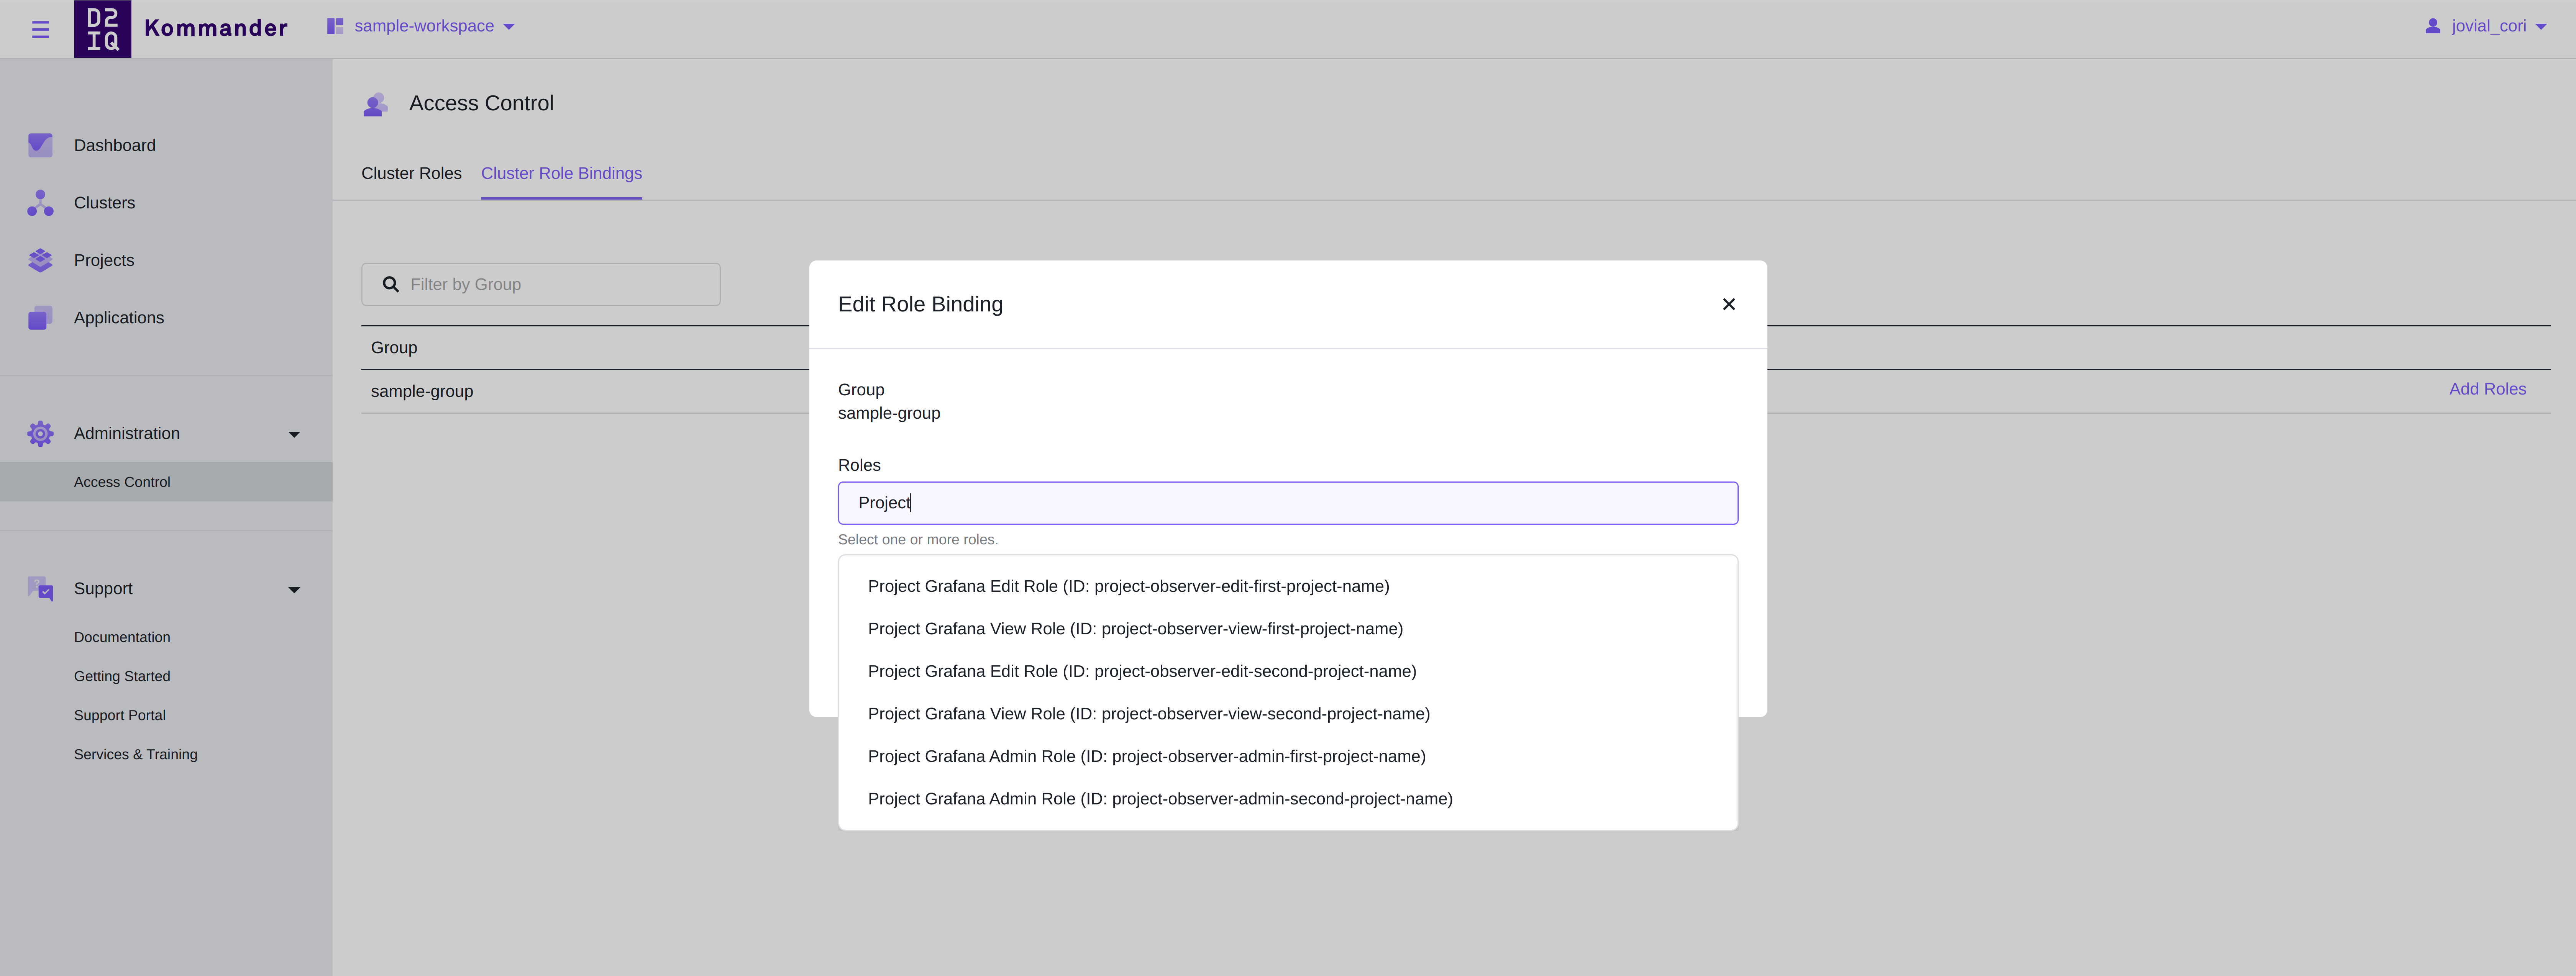
Select the correct role bindings for each group for a project at the workspace level.