Though you enable logging at the Workspace level, viewing the log data is done at the cluster level, using the cluster’s Grafana logging URL.
Run the following commands on the management cluster:
-
Execute the following command to get the namespace of your workspace
kubectl get workspacesCopy the value under
WORKSPACE NAMESPACEcolumn for your workspace. This may NOT be identical to the Display Name of theWorkspace. -
Export the
WORKSPACE_NAMESPACEvariable:export WORKSPACE_NAMESPACE=<WORKSPACE_NAMESPACE>Run the following commands on the attached cluster to access the Grafana UI:
Ensure you switched to the correct context or kubeconfig of the attached cluster for the following kubectl commands:
-
Get the Grafana URL:
kubectl get ingress -n ${WORKSPACE_NAMESPACE} grafana-logging -o go-template='https://{{with index .status.loadBalancer.ingress 0}}{{or .hostname .ip}}{{end}}{{with index .spec.rules 0}}{{with index .http.paths 0}}{{.path }}{{end}}{{end}}{{"\n"}}'
To view logs in Grafana:
-
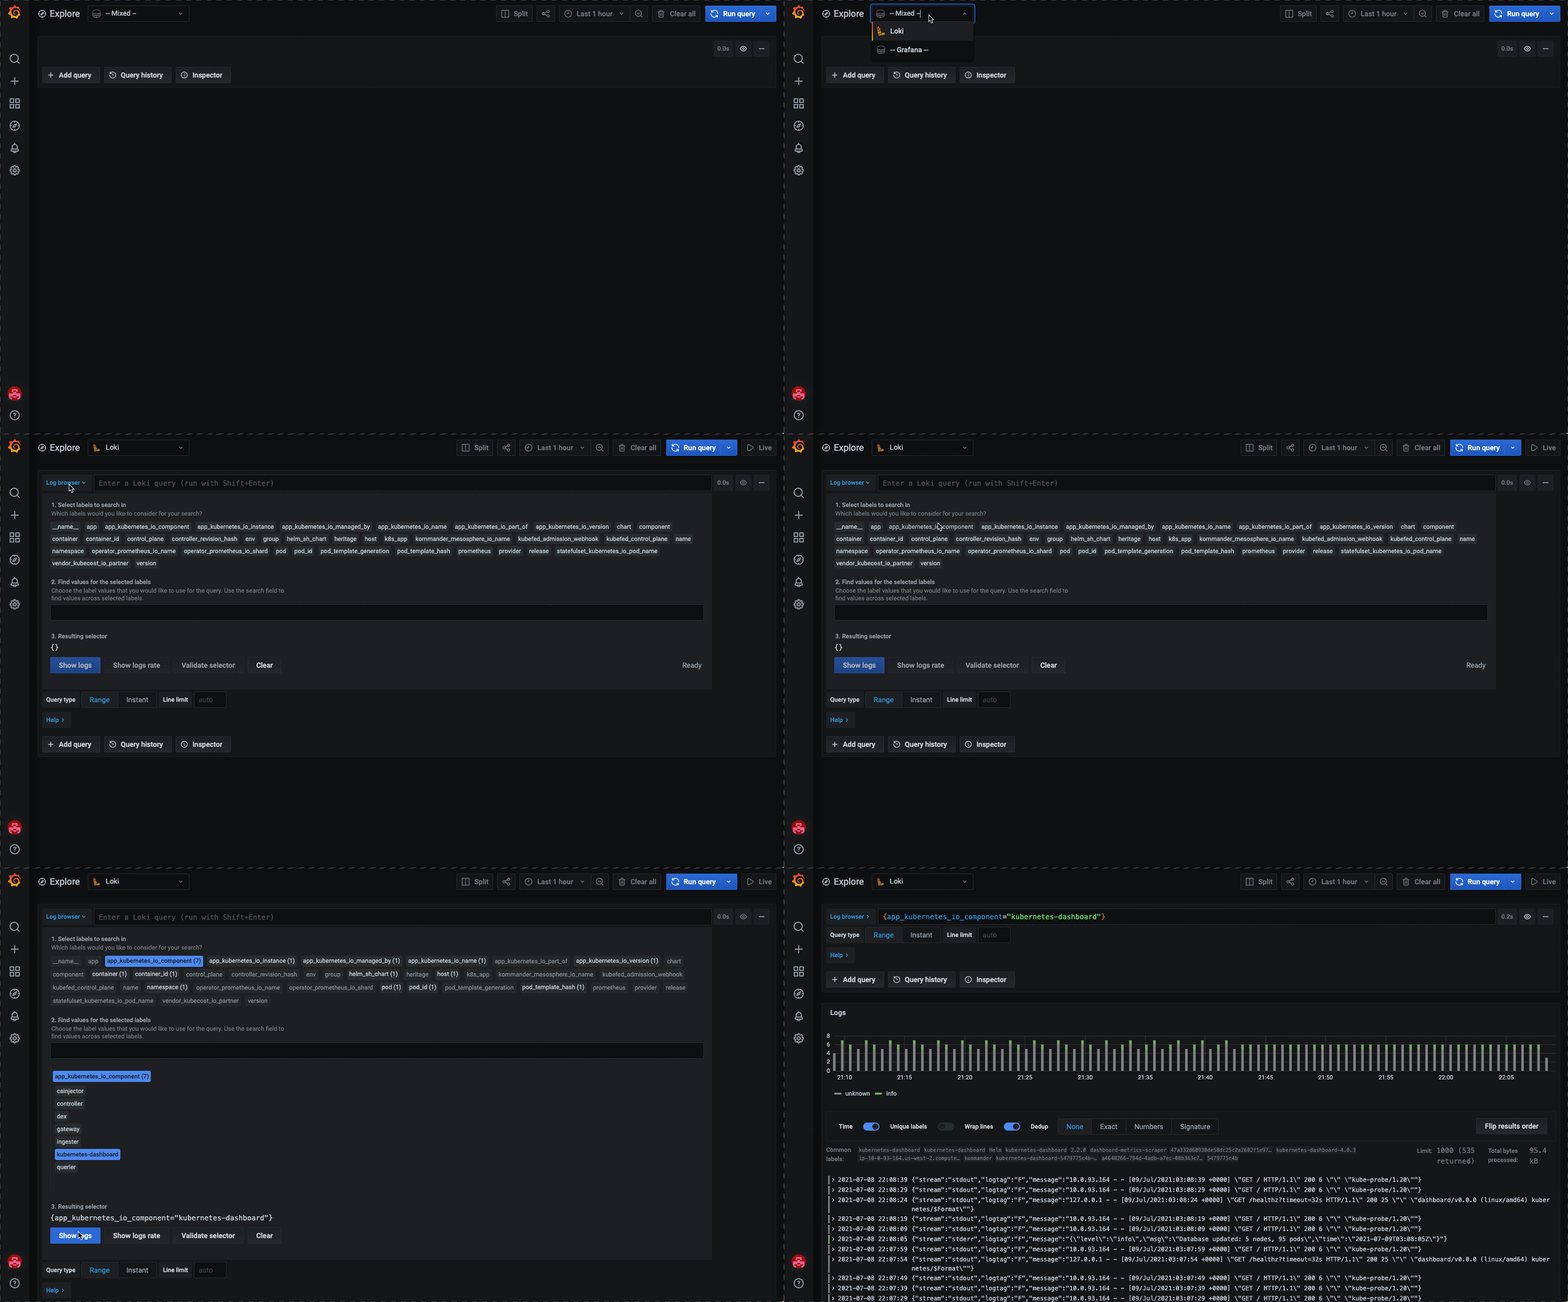
Go to the Explore tab:
kubectl get ingress -n ${WORKSPACE_NAMESPACE} grafana-logging -o go-template='https://{{with index .status.loadBalancer.ingress 0}}{{or .hostname .ip}}{{end}}{{with index .spec.rules 0}}{{with index .http.paths 0}}{{.path }}{{end}}{{end}}/explore{{"\n"}}' -
You may be prompted to log in using the SSO flow. See Kommander Security for more information.
-
At the top of the page, change the datasource to
Loki.
See the Grafana Loki documentation for more on how to use the interface to view and query logs.

 Kommander Documentation